
Page 424 - Laboratory Manual in Physical Geology
P. 424
directions through the rock body of Earth and along Earth’s Epicenter
surface. They are detected at seismic stations ( FIGURES 16.1 Seismic
and 16.2 ) and recorded as seismograms ( FIGURE 16.3 ). The Seismic waves
station
up and down motions on the seismograms in FIGURE 16.3
record the passing of seismic waves.
ACTIVITY Seismic
station
16.1 Earthquake Hazards
Inquiry
THINK | How do bedrock and sediment behave
About It during earthquakes and how does this Focus
affect human-made structures?
Fault
OBJECTIVE Experiment with models to determine FIGURE 16.1 The focus and epicenter of an earthquake.
how earthquake damage to buildings is related to the
Earth materials on which they are constructed. Apply
your experimental results to evaluate earthquake
hazards and human risks in San Francisco.
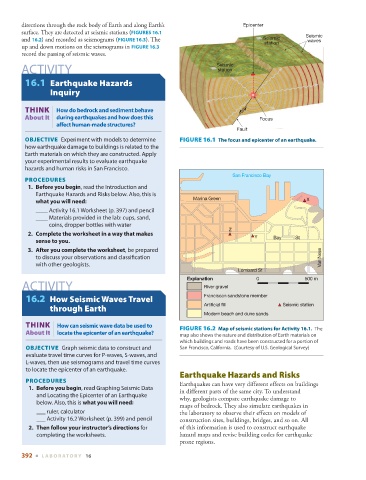
San Francisco Bay
PROCEDURES
1. Before you begin , read the Introduction and
Earthquake Hazards and Risks below. Also, this is
Marina Green X
what you will need :
____ Activity 16.1 Worksheet (p. 397 ) and pencil
____ Materials provided in the lab: cups, sand,
coins, dropper bottles with water
Z
2. Complete the worksheet in a way that makes
Y Bay St
sense to you.
3. After you complete the worksheet , be prepared
to discuss your observations and classifi cation Van Ness
with other geologists.
Lombard St
Explanation 0 500 m
ACTIVITY River gravel
Franciscan sandstone member
16.2 How Seismic Waves Travel
Artificial fill Seismic station
through Earth
Modern beach and dune sands
THINK | How can seismic wave data be used to FIGURE 16.2 Map of seismic stations for Activity 16.1. The
About It locate the epicenter of an earthquake? map also shows the nature and distribution of Earth materials on
which buildings and roads have been constructed for a portion of
OBJECTIVE Graph seismic data to construct and San Francisco, California. (Courtesy of U.S. Geological Survey)
evaluate travel time curves for P-waves, S-waves, and
L-waves, then use seismograms and travel time curves
to locate the epicenter of an earthquake.
Earthquake Hazards and Risks
PROCEDURES
Earthquakes can have very different effects on buildings
1. Before you begin , read Graphing Seismic Data
in different parts of the same city. To understand
and Locating the Epicenter of an Earthquake
why, geologists compare earthquake damage to
below. Also, this is what you will need :
maps of bedrock. They also simulate earthquakes in
___ ruler, calculator the laboratory to observe their effects on models of
___ Activity 16.2 Worksheet (p. 399 ) and pencil construction sites, buildings, bridges, and so on. All
2. Then follow your instructor’s directions for of this information is used to construct earthquake
completing the worksheets. hazard maps and revise building codes for earthquake
prone regions.
392 ■ L ABOR ATORY 16