
Page 426 - Laboratory Manual in Physical Geology
P. 426
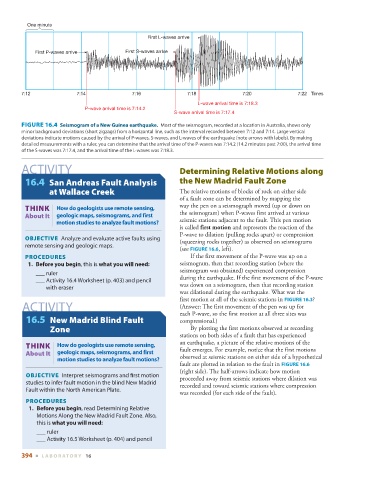
One minute
                                                  First L-waves arrive


             First P-waves arrive          First S-waves arrive


        7:12               7:14              7:16               7:18              7:20              7:22 Times
                                                                   L-wave arrival time is 7:18.3
                             P-wave arrival time is 7:14.2
                                                           S-wave arrival time is 7:17.4


          FIGURE 16.4    Seismogram of a New Guinea earthquake.  Most of the seismogram, recorded at a location in Australia, shows only


        minor background deviations (short zigzags) from a horizontal line, such as the interval recorded between 7:12 and 7:14. Large vertical
        deviations indicate motions caused by the arrival of P-waves, S-waves, and L-waves of the earthquake (note arrows with labels). By making
        detailed measurements with a ruler, you can determine that the arrival time of the P-waves was 7:14.2 (14.2 minutes past 7:00), the arrival time
        of the S-waves was 7:17.4, and the arrival time of the L-waves was 7:18.3.
         ACTIVITY                                                Determining Relative Motions along
         16.4  San Andreas Fault Analysis                    the New Madrid Fault Zone
                 at Wallace Creek                              The relative motions of blocks of rock on either side
                                                             of a fault zone can be determined by mapping the
                  |
               THINK  How do geologists use remote sensing,   way the pen on a seismograph moved (up or down on
         About It  geologic maps, seismograms, and first     the seismogram) when P-waves first arrived at various
                    motion studies to analyze fault motions?         seismic stations adjacent to the fault. This pen motion
                                                             is called  first motion  and represents the reaction of the
                                                             P-wave to dilation (pulling rocks apart) or compression
            OBJECTIVE   Analyze and evaluate active faults using   (squeezing rocks together) as observed on seismograms

         remote sensing and geologic maps.
                                                             (see   FIGURE   16.6   , left).
           PROCEDURES                                              If the first movement of the P-wave was up on a
              1.     Before you begin , this is  what you will need :   seismogram, then that recording station (where the
                                                             seismogram was obtained) experienced compression
                ___ ruler
                 ___ Activity 16.4 Worksheet (p.  403 ) and pencil   during the earthquake. If the first movement of the P-wave
                with eraser                                  was down on a seismogram, then that recording station
                                                             was dilational during the earthquake. What was the
                                                             first motion at all of the seismic stations in   FIGURE   16.3   ?
         ACTIVITY                                            (Answer: The first movement of the pen was up for
                                                             each P-wave, so the first motion at all three sites was
          16.5  New Madrid Blind Fault                       compressional.)
                  Zone                                             By plotting the first motions observed at recording
                                                             stations on both sides of a fault that has experienced
                THINK  |  How do geologists use remote sensing,   an earthquake, a picture of the relative motions of the
                                                             fault emerges. For example, notice that the first motions
          About It   geologic maps, seismograms, and first   observed at seismic stations on either side of a hypothetical
                    motion studies to analyze fault motions?
                                                             fault are plotted in relation to the fault in   FIGURE  16.6

                                                             (right side). The half-arrows indicate how motion
             OBJECTIVE   Interpret seismograms and fi rst motion   proceeded away from seismic stations where dilation was

          studies to infer fault motion in the blind New Madrid   recorded and toward seismic stations where compression
          Fault within the North American Plate.
                                                             was recorded (for each side of the fault).
             PROCEDURES
               1.     Before you begin , read Determining Relative
             Motions Along the New Madrid Fault Zone. Also,
             this is  what you will need :
                   ___ ruler
               ___ Activity 16.5 Worksheet (p.  404 ) and pencil


        394  ■  L ABOR ATORY  16