Page 428 - Laboratory Manual in Physical Geology
P. 428

P                                          D                         C
                                                                              C
                                                                                                C
                                                                                      C
                                                           D
                                                                        Fault
                     Up
                          Compression                                   D          C                   D
                                                                                       C
                                                              D
                       0      5     10    15
                            Scale in seconds                                                    D
                                                                     D
                       P                                                    C
                                                                                    C    D
                                                                D                                    D
                   Down                                                  C
                                                                                        C
                                                                C
                         Dilation
                                                                         Block X                   Block Y
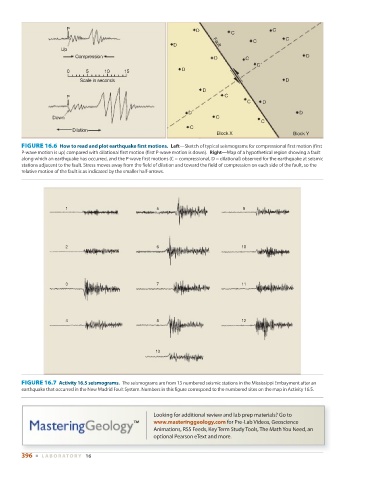
          FIGURE 16.6    How to read and plot earthquake first motions.           Left —Sketch of typical seismograms for compressional first motion (first
        P-wave motion is up) compared with dilational first motion (first P-wave motion is down).   Right —Map of a hypothetical region showing a fault
        along which an earthquake has occurred, and the P-wave first motions (C = compressional, D = dilational) observed for the earthquake at seismic
        stations adjacent to the fault. Stress moves away from the field of dilation and toward the field of compression on each side of the fault, so the
        relative motion of the fault is as indicated by the smaller half-arrows.


                       1                             5                            9


                       2                             6                            10


                       3                             7                            11


                       4                             8                            12


                                                     13


          FIGURE 16.7    Activity 16.5 seismograms.  The seismograms are from 13 numbered seismic stations in the Mississippi Embayment after an


        earthquake that occurred in the New Madrid Fault System. Numbers in this figure correspond to the numbered sites on the map in  Activity   16.5   .
                                                    Looking for additional review and lab prep materials? Go to
                                                    www.masteringgeology.com for Pre-Lab Videos, Geoscience
                                                    Animations, RSS Feeds, Key Term Study Tools, The Math You Need, an
                                                    optional Pearson eText and more.

        396  ■  L ABOR ATORY  16
   423   424   425   426   427   428   429   430   431   432   433