
Page 425 - Laboratory Manual in Physical Geology
P. 425
Graphing Seismic Data and
X Locating the Epicenter of an
Earthquake
An earthquake produces three main types of seismic
waves that radiate from its focus/epicenter at different
rates. Seismographs are instruments used to detect these
Y seismic waves and produce a seismogram —a record of
seismic wave motions obtained at a specific recording
station ( FIGURE 16.4 ). The seismograms are analyzed
using graphs of travel time versus distance ( FIGURE 16.5 )
to determine the seismic station’s distance from the
earthquake epicenter.
Z
3 Main Kinds of Seismic Waves
Seismographs can detect and record (as seismograms)
several types of seismic waves.
0 10 20 30 ■ P-waves : P for primary, because they travel fastest and
Time in seconds arrive at seismographs first. (They are compressional,
or “push–pull” waves.) P-waves are body waves, mean-
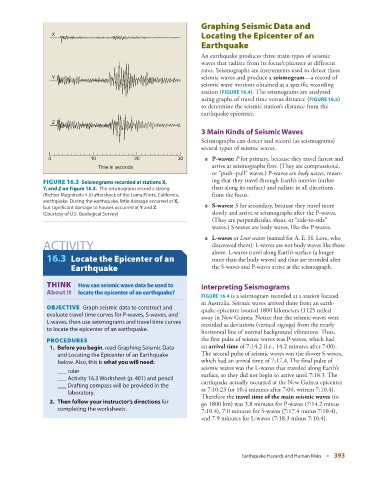
FIGURE 16.3 Seismograms recorded at stations X, ing that they travel through Earth’s interior (rather
Y, and Z on Figure 16.3. The seismograms record a strong than along its surface) and radiate in all directions
(Richter Magnitude 4.6) aftershock of the Loma Prieta, California, from the focus.
earthquake. During the earthquake, little damage occurred at X,
but significant damage to houses occurred at Y and Z . ■ S-waves : S for secondary, because they travel more
(Courtesy of U.S. Geological Survey) slowly and arrive at seismographs after the P-waves.
(They are perpendicular, shear, or “side-to-side”
waves.) S-waves are body waves, like the P-waves.
■ L-waves or Love waves (named for A. E. H. Love, who
ACTIVITY discovered them): L-waves are not body waves like those
above. L-waves travel along Earth’s surface (a longer
16.3 Locate the Epicenter of an route than the body waves) and thus are recorded after
Earthquake the S-waves and P-waves arrive at the seismograph.
|
THINK How can seismic wave data be used to Interpreting Seismograms
About It locate the epicenter of an earthquake?
FIGURE 16.4 is a seismogram recorded at a station located
in Australia. Seismic waves arrived there from an earth-
OBJECTIVE Graph seismic data to construct and quake epicenter located 1800 kilometers (1125 miles)
evaluate travel time curves for P-waves, S-waves, and away in New Guinea. Notice that the seismic waves were
L-waves, then use seismograms and travel time curves recorded as deviations (vertical zigzags) from the nearly
to locate the epicenter of an earthquake.
horizontal line of normal background vibrations. Thus,
PROCEDURES the first pulse of seismic waves was P-waves, which had
1. Before you begin , read Graphing Seismic Data an arrival time of 7:14.2 (i.e., 14.2 minutes after 7:00).
and Locating the Epicenter of an Earthquake The second pulse of seismic waves was the slower S-waves,
below. Also, this is what you will need : which had an arrival time of 7:17.4. The final pulse of
seismic waves was the L-waves that traveled along Earth’s
___ ruler
___ Activity 16.3 Worksheet (p. 401 ) and pencil surface, so they did not begin to arrive until 7:18.3. The
___ Drafting compass will be provided in the earthquake actually occurred at the New Guinea epicenter
laboratory. at 7:10:23 (or 10.4 minutes after 7:00, written 7:10.4).
Therefore the travel time of the main seismic waves (to
2. Then follow your instructor’s directions for go 1800 km) was 3.8 minutes for P-waves (7:14.2 minus
completing the worksheets. 7:10.4), 7.0 minutes for S-waves (7:17.4 minus 7:10.4),
and 7.9 minutes for L-waves (7:18.3 minus 7:10.4).
Earthquake Hazards and Human Risks ■ 393