
Page 427 - Laboratory Manual in Physical Geology
P. 427
Data Table (seismograph location) Distance to Travel Time of Main
Recording Station
Seismic Waves
Epicenter
(kilometers)
(minutes)
1800
1. Australia (Figure 16.4)
7.0
1800 3.8 GRAPH OF
1800 7.9 SEISMIC WAVE
2. Port Moresby, New Guinea 950 2.2 TRAVEL TIME
950 4.0 VS.
950 4.1 DISTANCE
3. Darwin, Australia 1500 3.2
1500 6.0
1500 6.6
4. Guam 1950 4.0
1950 7.4
5. Brisbane, Australia 2860 5.7
2860 10.0
6. Noumea, New Caledonia 3370 6.3
3370 14.8
30 30
7. Lembang, Java 3720 6.8
3720 12.0
8. Nhatrang, Vietnam 3960 7.0
3960 17.4
9. Matsushiro, Japan 4460 7.6
4460 13.5
25 4460 19.6 25
10. Vladivostok, Russia 5230 8.6
5230 22.9
11. Chittagong, Pakistan 6080 9.5
6080 17.0
6080 26.7
20 20
Travel time (minutes) 15 15
10 10
5 5
0 0
0 1000 2000 3000 4000 5000 6000
Distance to epicenter (kilometers)
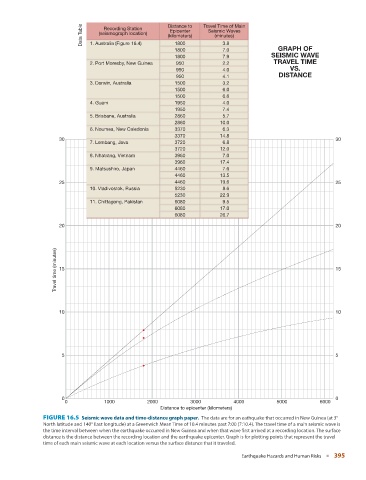
FIGURE 16.5 Seismic wave data and time-distance graph paper. The data are for an eathquake that occurred in New Guinea (at 3°
North latitude and 140° East longitude) at a Greenwich Mean Time of 10.4 minutes past 7:00 (7:10.4). The travel time of a main seismic wave is
the time interval between when the earthquake occurred in New Guinea and when that wave first arrived at a recording location. The surface
distance is the distance between the recording location and the earthquake epicenter. Graph is for plotting points that represent the travel
time of each main seismic wave at each location versus the surface distance that it traveled.
Earthquake Hazards and Human Risks ■ 395