
Page 136 - Lean six sigma demystified
P. 136
Chapter 4 e xC e L Power Too LS for Lean Six Sigm a 115
FIGURE 4-7 • Revised check sheet.
Excel disables QI macros
100.0%
12 90.0%
76.9%
10 80.0%
10
Calls about disabled macros 8 6 60.0%
70.0%
50.0%
40.0%
20.0%
2 4 3 30.0%
10.0%
0 0.0%
XL 2007 XL 2003
Excel version
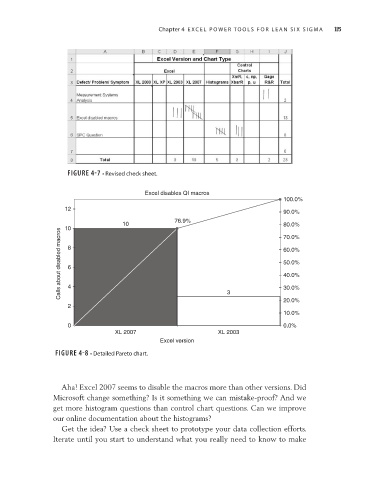
FIGURE 4-8 • Detailed Pareto chart.
Aha! Excel 2007 seems to disable the macros more than other versions. Did
Microsoft change something? Is it something we can mistake-proof? And we
get more histogram questions than control chart questions. Can we improve
our online documentation about the histograms?
Get the idea? Use a check sheet to prototype your data collection efforts.
Iterate until you start to understand what you really need to know to make