Page 135 - Lean six sigma demystified
P. 135

114        Lean Six Sigma  DemystifieD


                                 FIGURE 4-5 • Check sheet of support calls.

                        understanding Gage R&R, then we’d write “Gage R&R” in A3 and put a stroke
                        tally in the day of the week (e.g., Monday). Then continue adding to the check
                        sheet as the week goes on, adding defects, problems, or symptoms. By the end
                        of the week, you’ll have an interesting picture of support calls (Fig. 4-5).
                          Just add up the number of calls and one bucket or another will jump out as
                        the majority of the calls.

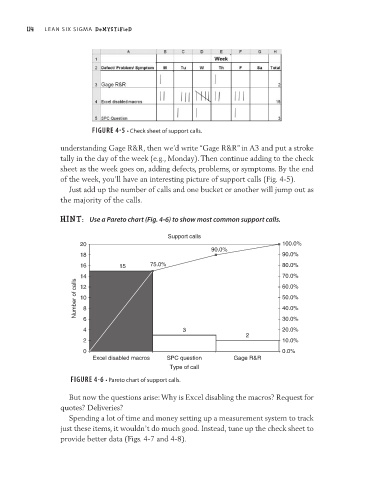
                        Hint:  Use a Pareto chart (Fig. 4-6) to show most common support calls.

                                                      Support calls
                             20                                                       100.0%
                                                                  90.0%
                             18                                                       90.0%
                             16         15       75.0%                                80.0%
                             14                                                       70.0%
                            Number of calls  10 8                                     50.0%
                             12
                                                                                      60.0%

                                                                                      40.0%


                              4 6                         3                           30.0%
                                                                                      20.0%
                                                                            2
                              2                                                       10.0%
                              0                                                       0.0%
                                 Excel disabled macros  SPC question    Gage R&R
                                                      Type of call
                           FIGURE 4-6 • Pareto chart of support calls.

                          But now the questions arise: Why is Excel disabling the macros? Request for
                        quotes? Deliveries?
                          Spending a lot of time and money setting up a measurement system to track
                        just these items, it wouldn’t do much good. Instead, tune up the check sheet to
                        provide better data (Figs. 4-7 and 4-8).
   130   131   132   133   134   135   136   137   138   139   140