
Page 200 - Lean six sigma demystified
P. 200
Chapter 5 Redu C ing d efe C t S with Six Sigm a 179
Seat minutes of outage in online systems
120000
GOOD
100000
80000
Minutes of outage 60000 Target
40000
20000
0
1/7 1/21 2/4 2/18 3/4 3/18 4/1 4/15 4/29 5/13 5/27 6/10 6/24 7/8 7/22 8/5 8/19 9/2 9/16 9/30 10/14 10/28 11/11 11/25 12/9 12/23
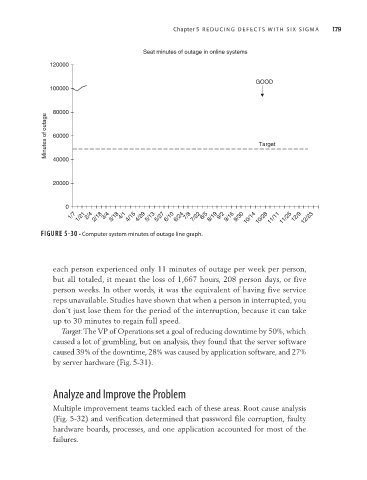
FIGURE 5-30 • Computer system minutes of outage line graph.
each person experienced only 11 minutes of outage per week per person,
but all totaled, it meant the loss of 1,667 hours, 208 person days, or five
person weeks. In other words, it was the equivalent of having five service
reps unavailable. Studies have shown that when a person in interrupted, you
don’t just lose them for the period of the interruption, because it can take
up to 30 minutes to regain full speed.
Target: The VP of Operations set a goal of reducing downtime by 50%, which
caused a lot of grumbling, but on analysis, they found that the server software
caused 39% of the downtime, 28% was caused by application software, and 27%
by server hardware (Fig. 5-31).
Analyze and Improve the Problem
Multiple improvement teams tackled each of these areas. Root cause analysis
(Fig. 5-32) and verification determined that password file corruption, faulty
hardware boards, processes, and one application accounted for most of the
failures.