
Page 201 - Lean six sigma demystified
P. 201
180 Lean Six Sigma DemystifieD
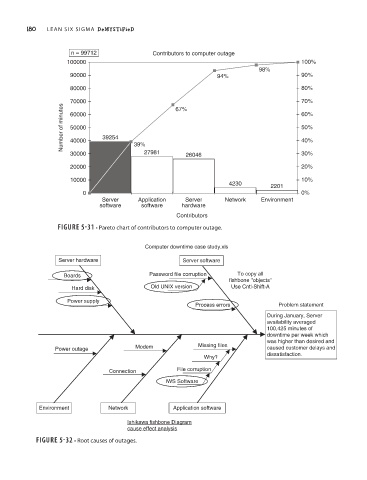
n = 99712 Contributors to computer outage
100000 100%
98%
90000 94% 90%
80000 80%
70000 67% 70%
Number of minutes 50000 39254 50%
60000
60%
40%
40000
30000 39% 27981 26046 30%
20000 20%
10000 10%
4230 2201
0 0%
Server Application Server Network Environment
software software hardware
Contributors
FIGURE 5-31 • Pareto chart of contributors to computer outage.
Computer downtime case study.xls
Server hardware Server software
Boards Password file corruption To copy all
fishbone "objects"
Hard disk Old UNIX version Use Cntl-Shift-A
Power supply
Process errors Problem statement
During January, Server
availability averaged
100,425 minutes of
downtime per week which
was higher than desired and
Power outage Modem Missing files caused customer delays and
Why? dissatisfaction.
Connection File corruption
IWS Software
Environment Network Application software
Ishikawa fishbone Diagram
cause effect analysis
FIGURE 5-32 • Root causes of outages.