
Page 203 - Lean six sigma demystified
P. 203
4
99%
Contributors to outage after countermeasures
95%
74%
8366
74% Reduction
45%
13292
30000
10000
25000
20000
15000
100%
70%
60%
80%
20%
90%
40%
30%
50%
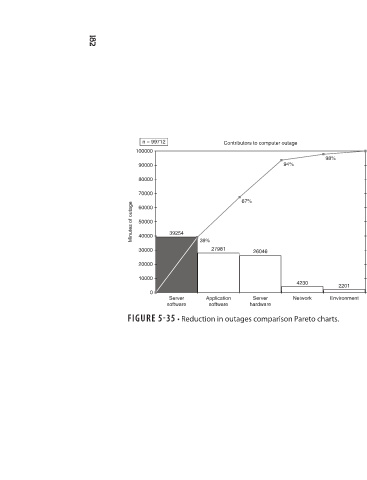
2201 10% 6123 2 5000 1189 296 Minutes of outage 0 0 0% Network Server Application Server Environment Environment hardware software software
98%
4230 Network
Contributors to computer outage 67% 26046 Server hardware
94%
27981 Application software FIGURE 5-35 • Reduction in outages comparison Pareto charts.
39%
39254 Server software
n = 99712 100000 90000 80000 70000 60000 50000 40000 Minutes of outage 30000 20000 10000 0
182