Page 277 - Lean six sigma demystified
P. 277

Chapter 8  Su S taining   i mpr ovement          255


                                                      Results chart
                      15.0
                             UCL                                                        14.49

                      14.0


                      13.0
                              CL                                                       12.03       Results
                                                                                                   UCL
                      12.0                                                                         +2 Sigma
                     Results                                              Unstable conditions      +1 Sigma
                                                                                                   Average
                      11.0                                                                         –1 Sigma
                                                                                                   –2 Sigma
                                                                                                   LCL
                      10.0
                             LCL                                                        9.57

                       9.0


                       8.0
                          123456789 10 11 12 13 14 15 16      17 18 19 20 21 22 23 24 25 26 27 28 29 30
                                                         Batch
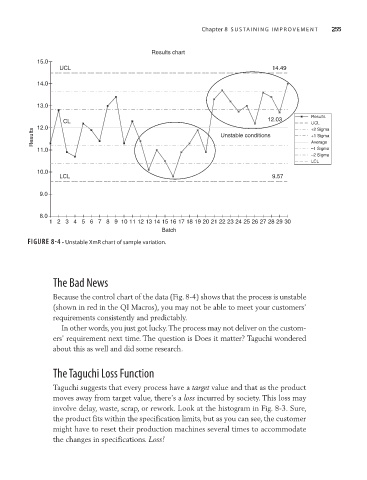
                    Figure 8-4 • Unstable XmR chart of sample variation.


                           The Bad News

                           Because the control chart of the data (Fig. 8-4) shows that the process is unstable
                           (shown in red in the QI Macros), you may not be able to meet your customers’
                           requirements consistently and predictably.

                             In other words, you just got lucky. The process may not deliver on the custom-
                           ers’ requirement next time. The question is Does it matter? Taguchi wondered
                           about this as well and did some research.


                           The Taguchi Loss Function

                           Taguchi suggests that every process have a target value and that as the product
                           moves away from target value, there’s a loss incurred by society. This loss may
                           involve delay, waste, scrap, or rework. Look at the histogram in Fig. 8-3. Sure,
                           the product fits within the specification limits, but as you can see, the customer
                           might have to reset their production machines several times to accommodate
                           the changes in specifications. Loss!
   272   273   274   275   276   277   278   279   280   281   282