
Page 274 - Lean six sigma demystified
P. 274
252 Lean Six Sigma DemystifieD
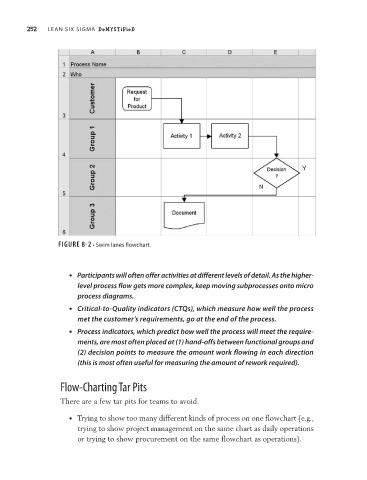
Figure 8-2 • Swim lanes flowchart.
• Participants will often offer activities at different levels of detail. As the higher-
level process flow gets more complex, keep moving subprocesses onto micro
process diagrams.
• Critical-to-Quality indicators (CTQs), which measure how well the process
met the customer’s requirements, go at the end of the process.
• Process indicators, which predict how well the process will meet the require-
ments, are most often placed at (1) hand-offs between functional groups and
(2) decision points to measure the amount work flowing in each direction
(this is most often useful for measuring the amount of rework required).
Flow-Charting Tar Pits
There are a few tar pits for teams to avoid.
• Trying to show too many different kinds of process on one flowchart (e.g.,
trying to show project management on the same chart as daily operations
or trying to show procurement on the same flowchart as operations).