
Page 278 - Lean six sigma demystified
P. 278
256 Lean Six Sigma DemystifieD
LSL USL
Loss
Waste
Rework
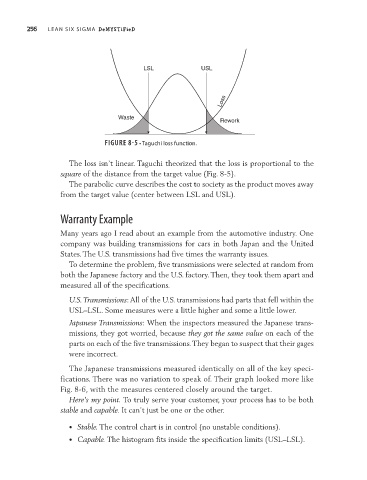
Figure 8-5 • Taguchi loss function.
The loss isn’t linear. Taguchi theorized that the loss is proportional to the
square of the distance from the target value (Fig. 8-5).
The parabolic curve describes the cost to society as the product moves away
from the target value (center between LSL and USL).
Warranty Example
Many years ago I read about an example from the automotive industry. One
company was building transmissions for cars in both Japan and the United
States. The U.S. transmissions had five times the warranty issues.
To determine the problem, five transmissions were selected at random from
both the Japanese factory and the U.S. factory. Then, they took them apart and
measured all of the specifications.
U.S. Transmissions: All of the U.S. transmissions had parts that fell within the
USL–LSL. Some measures were a little higher and some a little lower.
Japanese Transmissions: When the inspectors measured the Japanese trans-
missions, they got worried, because they got the same value on each of the
parts on each of the five transmissions. They began to suspect that their gages
were incorrect.
The Japanese transmissions measured identically on all of the key speci-
fications. There was no variation to speak of. Their graph looked more like
Fig. 8-6, with the measures centered closely around the target.
Here’s my point. To truly serve your customer, your process has to be both
stable and capable. It can’t just be one or the other.
• Stable. The control chart is in control (no unstable conditions).
• Capable. The histogram fits inside the specification limits (USL–LSL).