
Page 276 - Lean six sigma demystified
P. 276
254 Lean Six Sigma DemystifieD
Stable—In Control Unstable—Out of Control
Capable Good Analyze and correct special
causes
Not capable Analyze and reduce Correct special causes to get a
common cause variation stable process, then reduce
common cause variation
We recently sent out a QI Macros ezine about analyzing manufacturing per-
formance data. Many readers asked an interesting question: If my data fits
between the specification limits of the histogram, but the control chart is unsta-
ble, is that good or bad?
The Good News
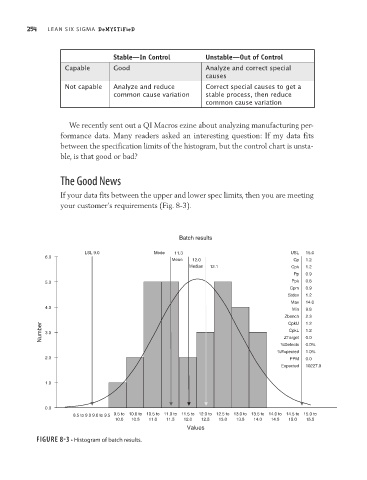
If your data fits between the upper and lower spec limits, then you are meeting
your customer’s requirements (Fig. 8-3).
Batch results
LSL 9.0 Mode 11.3 USL 15.0
6.0
Mean 12.0 Cp 1.2
Median 12.1 Cpk 1.2
Pp 0.9
5.0 Ppk 0.8
Cpm 0.9
Stdev 1.2
Max 14.0
4.0 Min 9.8
Zbench 2.3
1.2
CpkU
Number 3.0 ZTarget 1.2
CpkL
0.0
%Defects 0.0%
%Expected 1.0%
2.0 PPM 0.0
Expected 10227.9
1.0
0.0
8.5 to 9.0 9.0 to 9.5 9.5 to 10.0 to 10.5 to 11.0 to 11.5 to 12.0 to 12.5 to 13.0 to 13.5 to 14.0 to 14.5 to 15.0 to
10.0 10.5 11.0 11.5 12.0 12.5 13.0 13.5 14.0 14.5 15.0 15.5
Values
Figure 8-3 • Histogram of batch results.