
Page 283 - Lean six sigma demystified
P. 283
Chapter 8 Su S taining i mpr ovement 261
Two Rows/Columns
If the data have a numerator and a denominator that vary (e.g., defects/batch,
errors/transactions), then you will want to use the
• p chart (one defect maximum per piece)
• u chart (one or more defects per piece)
How can you tell which one to use? I ask myself “Can this widget have more
than one defect?” If yes, use the u chart; otherwise use the p chart.
Sometimes, as in this example, you can have more defects than samples. This is
another clue. Again, look for these patterns in the data and then select the chart.
Two or More Rows/Columns of Variable Data
Service industries don’t use these charts very often. They are mainly used in man-
ufacturing. If you have two or more rows or columns of variable data (time, weight,
length, width, diameter, or volume), then you can choose one of four charts.
1. XbarR (average and range, 2 to 10 rows/columns per sample)
2. XMedianR (median and range, 2 to 10 rows/columns per sample)
3. XbarS (average and standard deviation, 5 to 50 rows/columns per sample)
• I-MR-R (average, moving range between subgroups and range within
subgroups, 2 to 50 rows/columns per sample)
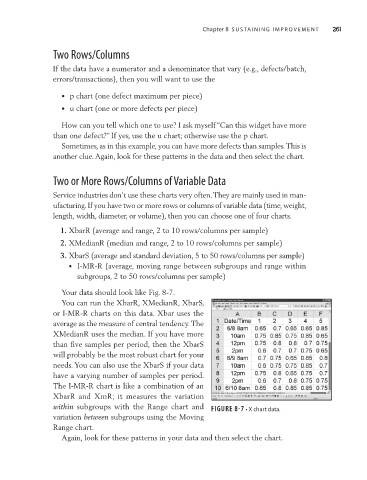
Your data should look like Fig. 8-7.
You can run the XbarR, XMedianR, XbarS,
or I-MR-R charts on this data. Xbar uses the
average as the measure of central tendency. The
XMedianR uses the median. If you have more
than five samples per period, then the XbarS
will probably be the most robust chart for your
needs. You can also use the XbarS if your data
have a varying number of samples per period.
The I-MR-R chart is like a combination of an
XbarR and XmR; it measures the variation
within subgroups with the Range chart and Figure 8-7 • X chart data.
variation between subgroups using the Moving
Range chart.
Again, look for these patterns in your data and then select the chart.