
Page 285 - Lean six sigma demystified
P. 285
Chapter 8 Su S taining i mpr ovement 263
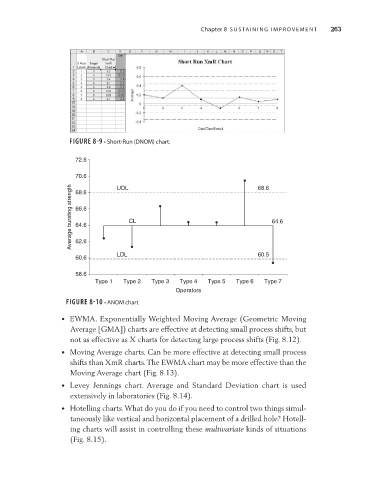
Figure 8-9 • Short-Run (DNOM) chart.
72.6
70.6 UDL 68.6
Average bursting strength 66.6 CL 64.6
68.6
64.6
62.6
LDL 60.5
60.6
58.6
Type 1 Type 2 Type 3 Type 4 Type 5 Type 6 Type 7
Operators
Figure 8-10 • ANOM chart
• EWMA. Exponentially Weighted Moving Average (Geometric Moving
Average [GMA]) charts are effective at detecting small process shifts, but
not as effective as X charts for detecting large process shifts (Fig. 8.12).
• Moving Average charts. Can be more effective at detecting small process
shifts than XmR charts. The EWMA chart may be more effective than the
Moving Average chart (Fig. 8.13).
• Levey Jennings chart. Average and Standard Deviation chart is used
extensively in laboratories (Fig. 8.14).
• Hotelling charts. What do you do if you need to control two things simul-
taneously like vertical and horizontal placement of a drilled hole? Hotell-
ing charts will assist in controlling these multivariate kinds of situations
(Fig. 8.15).