
Page 289 - Lean six sigma demystified
P. 289
Chapter 8 SuStaining impr ovement 267
• g and t charts. Geometric Median and Time Between control charts for rare
events like wrong site or wrong patient surgeries in a hospital (Fig. 8.16).
Hospitals use these charts to track never events—things that should never
happen, but do.
? still struggling
I have yet to use any of these charts in standard practice, but obviously some
people have advanced applications for them. I recommend getting familiar with
the X, c, p, and u charts before turning to these other types of charts.
Summary
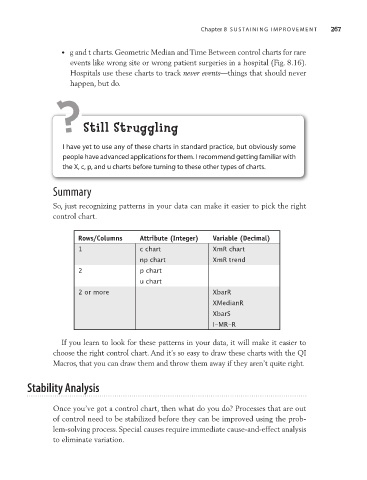
So, just recognizing patterns in your data can make it easier to pick the right
control chart.
Rows/Columns Attribute (Integer) Variable (Decimal)
1 c chart XmR chart
np chart XmR trend
2 p chart
u chart
2 or more XbarR
XMedianR
XbarS
I-MR-R
If you learn to look for these patterns in your data, it will make it easier to
choose the right control chart. And it’s so easy to draw these charts with the QI
Macros, that you can draw them and throw them away if they aren’t quite right.
Stability Analysis
Once you’ve got a control chart, then what do you do? Processes that are out
of control need to be stabilized before they can be improved using the prob-
lem-solving process. Special causes require immediate cause-and-effect analysis
to eliminate variation.