
Page 292 - Lean six sigma demystified
P. 292
270 Lean Six Sigma DemystifieD
To reduce the cost of inspection at Western Electric in the 1930s, Dr. Walter
S. Shewhart developed a set of formulas and constants to compensate for these
variations in sample size and population. That’s why they are sometimes called
Shewhart control charts. You can find these in any book on statistical process
control. So stop worrying about the formulas. Start monitoring your process using
the charts.
Control Plan
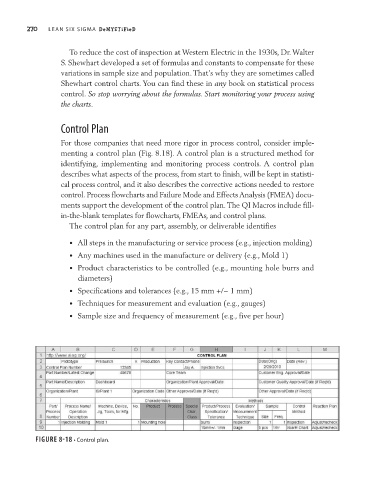
For those companies that need more rigor in process control, consider imple-
menting a control plan (Fig. 8.18). A control plan is a structured method for
identifying, implementing and monitoring process controls. A control plan
describes what aspects of the process, from start to finish, will be kept in statisti-
cal process control, and it also describes the corrective actions needed to restore
control. Process flowcharts and Failure Mode and Effects Analysis (FMEA) docu-
ments support the development of the control plan. The QI Macros include fill-
in-the-blank templates for flowcharts, FMEAs, and control plans.
The control plan for any part, assembly, or deliverable identifies
• All steps in the manufacturing or service process (e.g., injection molding)
• Any machines used in the manufacture or delivery (e.g., Mold 1)
• Product characteristics to be controlled (e.g., mounting hole burrs and
diameters)
• Specifications and tolerances (e.g., 15 mm +/− 1 mm)
• Techniques for measurement and evaluation (e.g., gauges)
• Sample size and frequency of measurement (e.g., five per hour)
Figure 8-18 • Control plan.