
Page 290 - Lean six sigma demystified
P. 290
268 Lean Six Sigma DemystifieD
Any point above UCL
UCL
Two of three points in this area
+2 Sigma
Four of five points in this area
+1 Sigma
Eight points in a row above CL
UCL
Eight points in a row below CL
–1 Sigma
Four of five points in this area
–2 Sigma
Two of three points in this area
LCL
Any point below LCL
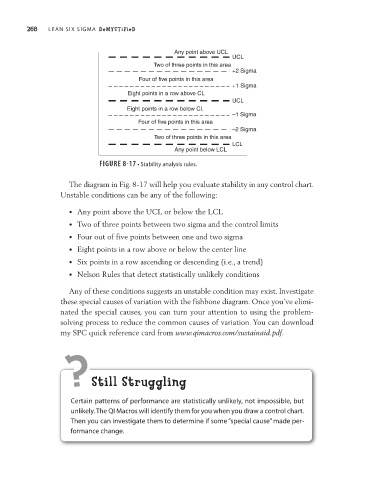
Figure 8-17 • Stability analysis rules.
The diagram in Fig. 8-17 will help you evaluate stability in any control chart.
Unstable conditions can be any of the following:
• Any point above the UCL or below the LCL
• Two of three points between two sigma and the control limits
• Four out of five points between one and two sigma
• Eight points in a row above or below the center line
• Six points in a row ascending or descending (i.e., a trend)
• Nelson Rules that detect statistically unlikely conditions
Any of these conditions suggests an unstable condition may exist. Investigate
these special causes of variation with the fishbone diagram. Once you’ve elimi-
nated the special causes, you can turn your attention to using the problem-
solving process to reduce the common causes of variation. You can download
my SPC quick reference card from www.qimacros.com/sustainaid.pdf.
? still struggling
Certain patterns of performance are statistically unlikely, not impossible, but
unlikely. The QI Macros will identify them for you when you draw a control chart.
Then you can investigate them to determine if some “special cause” made per-
formance change.