
Page 284 - Lean six sigma demystified
P. 284
262 Lean Six Sigma DemystifieD
? still struggling
The QI Macros Control Chart Wizard will automatically do this analysis and select
the most likely chart for you. Let the QI Macros do this for you until you learn the
pattern.
The np Chart
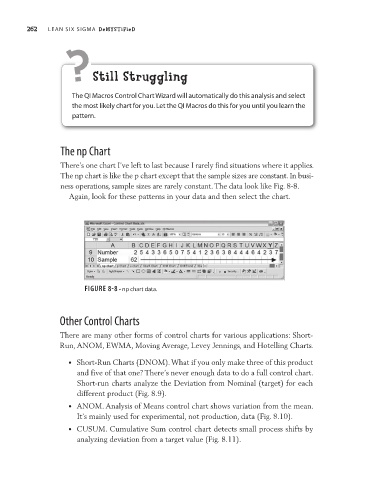
There’s one chart I’ve left to last because I rarely find situations where it applies.
The np chart is like the p chart except that the sample sizes are constant. In busi-
ness operations, sample sizes are rarely constant. The data look like Fig. 8-8.
Again, look for these patterns in your data and then select the chart.
Figure 8-8 • np chart data.
Other Control Charts
There are many other forms of control charts for various applications: Short-
Run, ANOM, EWMA, Moving Average, Levey Jennings, and Hotelling Charts.
• Short-Run Charts (DNOM). What if you only make three of this product
and five of that one? There’s never enough data to do a full control chart.
Short-run charts analyze the Deviation from Nominal (target) for each
different product (Fig. 8.9).
• ANOM. Analysis of Means control chart shows variation from the mean.
It’s mainly used for experimental, not production, data (Fig. 8.10).
• CUSUM. Cumulative Sum control chart detects small process shifts by
analyzing deviation from a target value (Fig. 8.11).