
Page 222 - Materials Chemistry, Second Edition
P. 222
208 LIFE CYCLE ASSESSMENT HANDBOOK
8.5.3 LCA and ExLCA Results and Discussion
Environmental impacts for the Cu-Cl thermochemical hydrogen production
process, based on one MJ exergy of hydrogen production, are presented in this
section. The following CML 2001 impact categories are examined:
• acidification potential (AP)
• eutrophication potential (EP)
• global warming potential (GWP)
• ozone depletion potential (ODP)
Environmental effects for nuclear-based hydrogen production using the
five-step Cu-Cl thermochemical cycle in terms of the four above impact cat-
egories are calculated by altering the lifetime of the overall system from 10
years to 100 years for two plant capacities (125,000 and 62,500 kg H 2 /day).
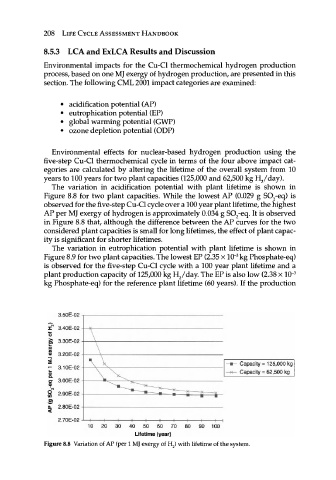
The variation in acidification potential with plant lifetime is shown in
Figure 8.8 for two plant capacities. While the lowest AP (0.029 g S0 2-eq) is
observed for the five-step Cu-Cl cycle over a 100 year plant lifetime, the highest
AP per MJ exergy of hydrogen is approximately 0.034 g S0 2-eq. It is observed
in Figure 8.8 that, although the difference between the AP curves for the two
considered plant capacities is small for long lifetimes, the effect of plant capac-
ity is significant for shorter lifetimes.
The variation in eutrophication potential with plant lifetime is shown in
3
Figure 8.9 for two plant capacities. The lowest EP (2.35 x 10~ kg Phosphate-eq)
is observed for the five-step Cu-Cl cycle with a 100 year plant lifetime and a
plant production capacity of 125,000 kg H 2 /day The EP is also low (2.38 x 10" 3
kg Phosphate-eq) for the reference plant lifetime (60 years). If the production
3.50E-I
2* 3.40E
o \
gj 3.30E
0) \
S 3.20E
Έ \ V -m- Capacity = 125,000 kg
*- 3.10E
a> w —κ- Capacity = 62,500 kg
σ 3.00Ε
Q)
I
gf 2.90E —Hi— ^■i I
3
üT 2.80E
< - I — i 1 1 1 \— 1 1 1 1 1 1
2.70E-I 10 20 30 40 50 60 70 80 90 100
Lifetime (year)
Figure 8.8 Variation of AP (per 1 MJ exergy of H 2) with lifetime of the system.