
Page 223 - Materials Chemistry, Second Edition
P. 223
EXERGY ANALYSIS AND ITS CONNECTION TO LIFE CYCLE ASSESSMENT 209
^ 2.90E-03
X
I—
> 2.80E-03
Φ
Φ 2.70Ε-03
2.60E-03
£ -Capacity = 125,000 kg
2.50E-03 -Capacity = 62,500 kg
■§. 2.40E-03
0)
o
£ 2.30E-03
3
ω 2.20E-03 H h H H
10 20 30 40 50 60 70 80 90 100
Lifetime (year)
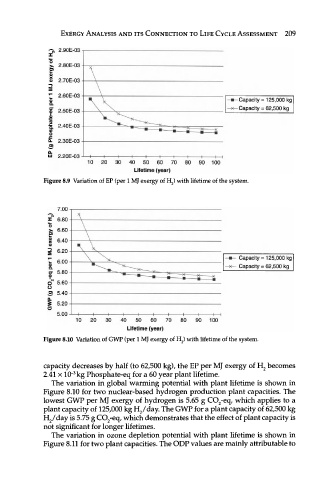
Figure 8.9 Variation of EP (per 1 MJ exergy of H 2) with lifetime of the system.
Capacity = 125,000 kg
Capacity = 62,500 kg
40 50 60 70
Lifetime (year)
Figure 8.10 Variation of GWP (per 1 MJ exergy of H 2) with lifetime of the system.
capacity decreases by half (to 62,500 kg), the EP per MJ exergy of H 2 becomes
3
2.41 x 10" kg Phosphate-eq for a 60 year plant lifetime.
The variation in global warming potential with plant lifetime is shown in
Figure 8.10 for two nuclear-based hydrogen production plant capacities. The
lowest GWP per MJ exergy of hydrogen is 5.65 g C0 2-eq, which applies to a
plant capacity of 125,000 kg H 2/day. The GWP for a plant capacity of 62,500 kg
H 2 /day is 5.75 g C0 2-eq, which demonstrates that the effect of plant capacity is
not significant for longer lifetimes.
The variation in ozone depletion potential with plant lifetime is shown in
Figure 8.11 for two plant capacities. The ODP values are mainly attributable to