
Page 224 - Materials Chemistry, Second Edition
P. 224
210 LIFE CYCLE ASSESSMENT HANDBOOK
1.40E-07
? 1.38E-07
Capacity = 125,000 kg
Capacity = 62,500 kg
40 50 60 70
Lifetime (year)
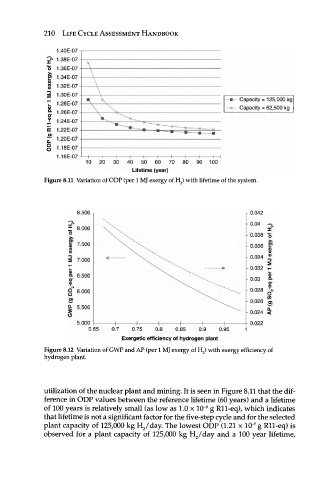
Figure 8.11 Variation of ODP (per 1 MJ exergy of H 2) with lifetime of the system.
fe V Γ 0.042
Ö.OUU
0.04
J o 8.000 0.038 I
>»
0)
X 7.500 0.036 O)
Φ 0.034 f
2 7.000
0.032 ^
Φ k.
Q. 6.500
σ 0.03 8.
σ
g 6.000 0.028 O >
CO
3 ^\. L 0.026 CT
| 5.500
^ ^ 0.024 <
5.000 1 1 1 1 1 1 1 0.022
0.65 0.7 0.75 0.8 0.85 0.9 0.95 1
Exergetic efficiency of hydrogen plant
Figure 8.12 Variation of GWP and AP (per 1 MJ exergy of H 2) with exergy efficiency of
hydrogen plant.
utilization of the nuclear plant and mining. It is seen in Figure 8.11 that the dif-
ference in ODP values between the reference lifetime (60 years) and a lifetime
9
of 100 years is relatively small (as low as 1.0 x 10~ g Rll-eq), which indicates
that lifetime is not a significant factor for the five-step cycle and for the selected
7
plant capacity of 125,000 kg H 2 /day The lowest ODP (1.21 x 10" g Rll-eq) is
observed for a plant capacity of 125,000 kg H 2 /day and a 100 year lifetime,