
Page 255 - Materials Chemistry, Second Edition
P. 255
A CASE STUDY OF THE PRACTICE OF SUSTAINABLE SUPPLY 243
llllilll
6 2
6 4
6 3
6 3
58
60
5 6
4.2 3.3 3.2 4.9 5.7 4.6 4.5 4.4
/ / 7 7 7 7 7 7
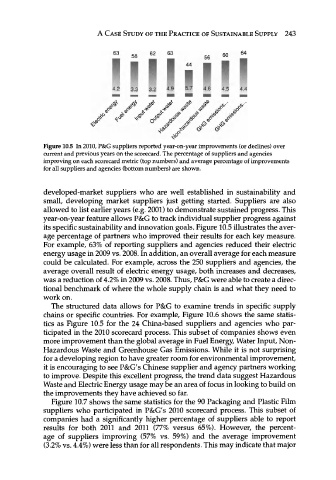
Figure 10.5 In 2010, P&G suppliers reported year-on-year improvements (or declines) over
current and previous years on the scorecard. The percentage of suppliers and agencies
improving on each scorecard metric (top numbers) and average percentage of improvements
for all suppliers and agencies (bottom numbers) are shown.
developed-market suppliers who are well established in sustainability and
small, developing market suppliers just getting started. Suppliers are also
allowed to list earlier years (e.g. 2001) to demonstrate sustained progress. This
year-on-year feature allows P&G to track individual supplier progress against
its specific sustainability and innovation goals. Figure 10.5 illustrates the aver-
age percentage of partners who improved their results for each key measure.
For example, 63% of reporting suppliers and agencies reduced their electric
energy usage in 2009 vs. 2008. In addition, an overall average for each measure
could be calculated. For example, across the 250 suppliers and agencies, the
average overall result of electric energy usage, both increases and decreases,
was a reduction of 4.2% in 2009 vs. 2008. Thus, P&G were able to create a direc-
tional benchmark of where the whole supply chain is and what they need to
work on.
The structured data allows for P&G to examine trends in specific supply
chains or specific countries. For example, Figure 10.6 shows the same statis-
tics as Figure 10.5 for the 24 China-based suppliers and agencies who par-
ticipated in the 2010 scorecard process. This subset of companies shows even
more improvement than the global average in Fuel Energy, Water Input, Non-
Hazardous Waste and Greenhouse Gas Emissions. While it is not surprising
for a developing region to have greater room for environmental improvement,
it is encouraging to see P&G's Chinese supplier and agency partners working
to improve. Despite this excellent progress, the trend data suggest Hazardous
Waste and Electric Energy usage may be an area of focus in looking to build on
the improvements they have achieved so far.
Figure 10.7 shows the same statistics for the 90 Packaging and Plastic Film
suppliers who participated in P&G's 2010 scorecard process. This subset of
companies had a significantly higher percentage of suppliers able to report
results for both 2011 and 2011 (77% versus 65%). However, the percent-
age of suppliers improving (57% vs. 59%) and the average improvement
(3.2% vs. 4.4%) were less than for all respondents. This may indicate that major