
Page 254 - Materials Chemistry, Second Edition
P. 254
242 LIFE CYCLE ASSESSMENT HANDBOOK
29
Capital
Chemicals
■ Durables/devices
■ External manufacturing
■ Global brand building
Global business services
■ Logistics
Nat. comm. & ingredients
Packaging & hygiene
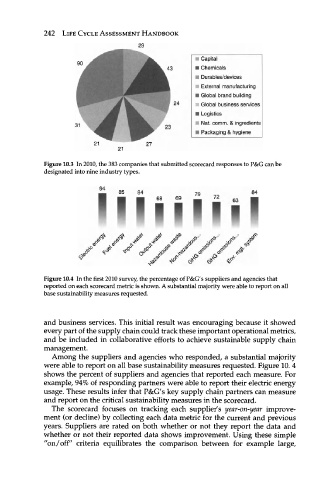
Figure 10.3 In 2010, the 383 companies that submitted scorecard responses to P&G can be
designated into nine industry types.
Hliiiiil
94
_
84
85
84
7 9
jf* ^ .** .*? ^ <§>' &' <&'' *&
f ^ .«sr f &
f no >5> >S> x V
* * & & <P
Figure 10.4 In the first 2010 survey, the percentage of P&G's suppliers and agencies that
reported on each scorecard metric is shown. A substantial majority were able to report on all
base sustainability measures requested.
and business services. This initial result was encouraging because it showed
every part of the supply chain could track these important operational metrics,
and be included in collaborative efforts to achieve sustainable supply chain
management.
Among the suppliers and agencies who responded, a substantial majority
were able to report on all base sustainability measures requested. Figure 10. 4
shows the percent of suppliers and agencies that reported each measure. For
example, 94% of responding partners were able to report their electric energy
usage. These results infer that P&G's key supply chain partners can measure
and report on the critical sustainability measures in the scorecard.
The scorecard focuses on tracking each supplier's year-on-year improve-
ment (or decline) by collecting each data metric for the current and previous
years. Suppliers are rated on both whether or not they report the data and
whether or not their reported data shows improvement. Using these simple
"on/off criteria equilibrates the comparison between for example large,