
Page 252 - Materials Chemistry, Second Edition
P. 252
240 LIFE CYCLE ASSESSMENT HANDBOOK
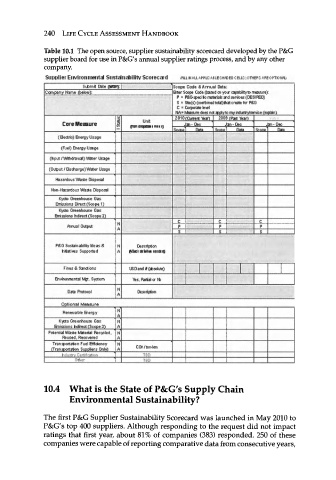
Table 10.1 The open source, supplier sustainability scorecard developed by the P&G
supplier board for use in P&G's annual supplier ratings process, and by any other
company.
Supplier Environmental Siistaiiiabilitv Scorecard (M*AiiA*nüMi&3M>tocB,v$:oTHB&ßMQrn>w*>
Submit Date (WON):! Scope Code £ Amual Data:
Company Name (t>elow): Enter Scope Code (based on your capability to measure):
P ■ P&G-speciic materials and senices (DESI FED)
$ ■ Site(s)(corrbinedtotal)th3t create for P&G
C = Corporate texel
NA» Measure does net apply to my industry/service (explain)
2010 fCurrent Year) 2003 fPast Vear)
Unit
Core Measure jj $>w»dflDp*eimeiO Jan· Dec Jan · Dec Jan-Dec
Sccoe] Data ' Secoel C&ta Spcoe
l·— ——————— ■ -4
(Bectric) Energy Usage
(Fuel) Energy Usage
(hput/Withdrawal) \A6ter Usage j !
(Output /Discharge) Water Usage !
Ί
Ha zardous Wast< i Disposal
Non-Hazardous Waste Disposal
Kyoto Greenhouse Gas
Emissions Direct (Scope 1)
Kyoto Greenhouse Gas
I finri ssions Indirect (Scope 2)
Amual Output ; A p n p j .....£.....
P
$ i $ 1 $
P& G Sustain ability We as & | N Description
hitiatives Supported j A fitc»*ta!iaii«*c5
Fines & Sanctions USDard* (absolute)
LULL. II ,. I. LI., 1 , , M l , „ I, . n, „ „ , J „ „
Environmental Mjt. System Ves. Partial or N>
Data Protocol j 7 Description
Optional Measure
Renewable Energy j J
Kyoto Greenhouse Gas ! N
Emissions hdirect (Scope 3) j A
| Potential Waste Ivbterial Recycled, 1N
Reused, Recovered I A
Transportation Fuel Efficiency ] N
(Transportation Suppliers Only) IA COs/ton-km
Industry Certification T8D
1 Other 1 T8D
10.4 What is the State of P&G's Supply Chain
Environmental Sustainability?
The first P&G Supplier Sustainability Scorecard was launched in May 2010 to
P&G's top 400 suppliers. Although responding to the request did not impact
ratings that first year, about 81% of companies (383) responded. 250 of these
companies were capable of reporting comparative data from consecutive years,