
Page 249 - Materials Chemistry, Second Edition
P. 249
A CASE STUDY OF THE PRACTICE OF SUSTAINABLE SUPPLY 237
non-concentrated detergents and assumed they were getting less value, even
though the number of washes per container was the same. Despite efforts to
educate consumers that they were getting equal value, the on-shelf impres-
sion was difficult to overcome and eventually declining sales resulted in
having to revert to non-concentrated formulas. It was not until 2007, when
a major U.S. retailer helped lead an industry-wide switch to concentrated
detergents that consumers accepted the change. The concentrated detergent
case shows that sustainable product development from manufacturers is not
enough to achieve more sustainable living practices. Effective and consistent
communications from non-manufacturers, like retailers, utility companies,
schools, or non-governmental organizations (NGOs) are needed to encour-
age change in people's living styles.
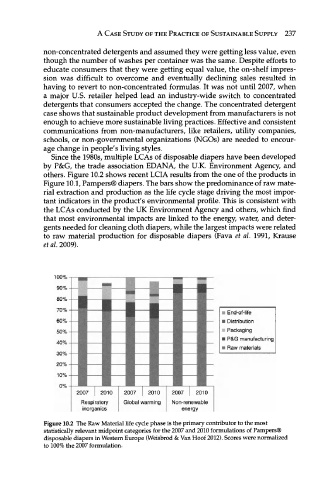
Since the 1980s, multiple LCAs of disposable diapers have been developed
by P&G, the trade association EDANA, the U.K. Environment Agency, and
others. Figure 10.2 shows recent LCI A results from the one of the products in
Figure 10.1, Pampers® diapers. The bars show the predominance of raw mate-
rial extraction and production as the life cycle stage driving the most impor-
tant indicators in the product's environmental profile. This is consistent with
the LCAs conducted by the UK Environment Agency and others, which find
that most environmental impacts are linked to the energy, water, and deter-
gents needed for cleaning cloth diapers, while the largest impacts were related
to raw material production for disposable diapers (Fava et al. 1991, Krause
rfd.2009).
I End-of-life
i Distribution
Packaging
i P&G manufacturing
i Raw materials
2010
Non-renewable
energy
Figure 10.2 The Raw Material life cycle phase is the primary contributor to the most
statistically relevant midpoint categories for the 2007 and 2010 formulations of Pampers®
disposable diapers in Western Europe (Weisbrod & Van Hoof 2012). Scores were normalized
to 100% the 2007 formulation.