
Page 256 - Materials Chemistry, Second Edition
P. 256
244 LIFE CYCLE ASSESSMENT HANDBOOK
-1.3
^ ^ y y #° y &- #··■
-Ö» <<^ \O v 0 ^ ,<}> <i>° « ^ e ^
* ° . / J # r£>
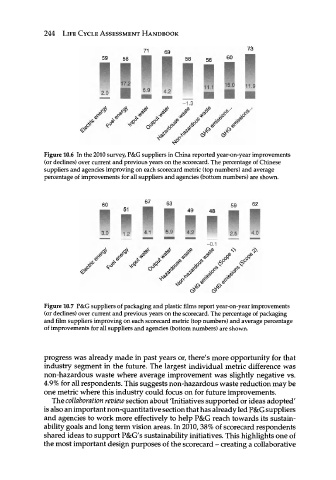
Figure 10.6 In the 2010 survey, P&G suppliers in China reported year-on-year improvements
(or declines) over current and previous years on the scorecard. The percentage of Chinese
suppliers and agencies improving on each scorecard metric (top numbers) and average
percentage of improvements for all suppliers and agencies (bottom numbers) are shown.
1 51 ** 63 49 48 5 9 62
60
■ I I ■ P 2.5 4.0
1 2 4.1 5.9 4.2
-0.1
<$ / *<$ N / </ *Φ ^ έβ 1 ^ έ? ^ NN Jt 0>
<&
/
/ ^ * S / / ./ ./
^ «y jf jf
& &
Figure 10.7 P&G suppliers of packaging and plastic films report year-on-year improvements
(or declines) over current and previous years on the scorecard. The percentage of packaging
and film suppliers improving on each scorecard metric (top numbers) and average percentage
of improvements for all suppliers and agencies (bottom numbers) are shown.
progress was already made in past years or, there's more opportunity for that
industry segment in the future. The largest individual metric difference was
non-hazardous waste where average improvement was slightly negative vs.
4.9% for all respondents. This suggests non-hazardous waste reduction may be
one metric where this industry could focus on for future improvements.
The collaboration review section about Initiatives supported or ideas adopted 7
is also an important non-quantitative section that has already led P&G suppliers
and agencies to work more effectively to help P&G reach towards its sustain-
ability goals and long term vision areas. In 2010,38% of scorecard respondents
shared ideas to support P&G's sustainability initiatives. This highlights one of
the most important design purposes of the scorecard - creating a collaborative