
Page 195 - Materials Chemistry, Second Edition
P. 195
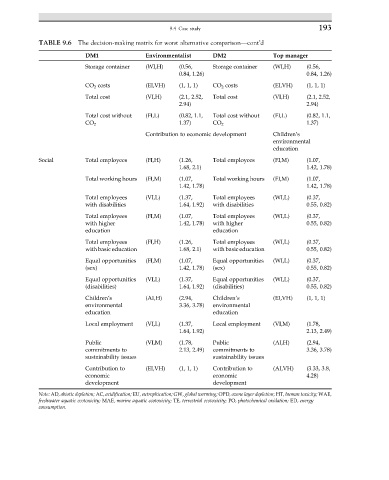
9.4 Case study                           193
            TABLE 9.6  The decision-making matrix for worst alternative comparison—cont’d
                         DM1             Environmentalist   DM2              Top manager
                         Storage container  (WI,H)  (0.56,  Storage container  (WI,H)  (0.56,
                                                   0.84, 1.26)                        0.84, 1.26)
                         CO 2 costs      (EI,VH)   (1, 1, 1)  CO 2 costs     (EI,VH)  (1, 1, 1)
                         Total cost      (VI,H)    (2.1, 2.52,  Total cost   (VI,H)   (2.1, 2.52,
                                                   2.94)                              2.94)
                         Total cost without  (FI,L)  (0.82, 1.1,  Total cost without  (FI,L)  (0.82, 1.1,
                         CO 2                      1.37)    CO 2                      1.37)
                                         Contribution to economic development  Children’s
                                                                             environmental
                                                                             education
            Social       Total employees  (FI,H)   (1.26,   Total employees  (FI,M)   (1.07,
                                                   1.68, 2.1)                         1.42, 1.78)
                         Total working hours  (FI,M)  (1.07,  Total working hours  (FI,M)  (1.07,
                                                   1.42, 1.78)                        1.42, 1.78)
                         Total employees  (VI,L)   (1.37,   Total employees  (WI,L)   (0.37,
                         with disabilities         1.64, 1.92)  with disabilities     0.55, 0.82)
                         Total employees  (FI,M)   (1.07,   Total employees  (WI,L)   (0.37,
                         with higher               1.42, 1.78)  with higher           0.55, 0.82)
                         education                          education
                         Total employees  (FI,H)   (1.26,   Total employees  (WI,L)   (0.37,
                         with basic education      1.68, 2.1)  with basic education   0.55, 0.82)
                         Equal opportunities  (FI,M)  (1.07,  Equal opportunities  (WI,L)  (0.37,
                         (sex)                     1.42, 1.78)  (sex)                 0.55, 0.82)
                         Equal opportunities  (VI,L)  (1.37,  Equal opportunities  (WI,L)  (0.37,
                         (disabilities)            1.64, 1.92)  (disabilities)        0.55, 0.82)
                         Children’s      (AI,H)    (2.94,   Children’s       (EI,VH)  (1, 1, 1)
                         environmental             3.36, 3.78)  environmental
                         education                          education
                         Local employment  (VI,L)  (1.37,   Local employment  (VI,M)  (1.78,
                                                   1.64, 1.92)                        2.13, 2.49)
                         Public          (VI,M)    (1.78,   Public           (AI,H)   (2.94,
                         commitments to            2.13, 2.49)  commitments to        3.36, 3.78)
                         sustainability issues              sustainability issues
                         Contribution to  (EI,VH)  (1, 1, 1)  Contribution to  (AI,VH)  (3.33, 3.8,
                         economic                           economic                  4.28)
                         development                        development
            Note: AD, abiotic depletion; AC, acidification; EU, eutrophication; GW, global warming; OPD, ozone layer depletion; HT, human toxicity; WAE,
            freshwater aquatic ecotoxicity; MAE, marine aquatic ecotoxicity; TE, terrestrial ecotoxicity; PO, photochemical oxidation; ED, energy
            consumption.