
Page 199 - Materials Chemistry, Second Edition
P. 199
9.4 Case study 197
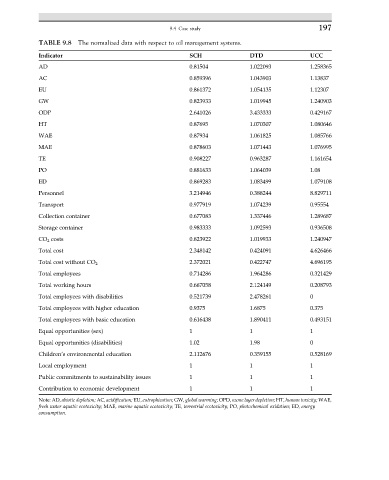
TABLE 9.8 The normalized data with respect to oil management systems.
Indicator SCH DTD UCC
AD 0.81504 1.022093 1.258365
AC 0.859396 1.043903 1.13837
EU 0.861372 1.054135 1.12307
GW 0.823933 1.019945 1.240903
ODP 2.641026 3.433333 0.429167
HT 0.87695 1.070307 1.080646
WAE 0.87934 1.061825 1.085766
MAE 0.878603 1.071443 1.076995
TE 0.908227 0.963287 1.161654
PO 0.881633 1.064039 1.08
ED 0.869283 1.083499 1.079108
Personnel 3.214946 0.388244 8.829711
Transport 0.977919 1.074239 0.95554
Collection container 0.677083 1.337446 1.289687
Storage container 0.983333 1.092593 0.936508
CO 2 costs 0.823922 1.019933 1.240947
Total cost 2.348142 0.424091 4.626466
2.372021 0.422747 4.696195
Total cost without CO 2
Total employees 0.714286 1.964286 0.321429
Total working hours 0.667058 2.124149 0.208793
Total employees with disabilities 0.521739 2.478261 0
Total employees with higher education 0.9375 1.6875 0.375
Total employees with basic education 0.616438 1.890411 0.493151
Equal opportunities (sex) 1 1 1
Equal opportunities (disabilities) 1.02 1.98 0
Children’s environmental education 2.112676 0.359155 0.528169
Local employment 1 1 1
Public commitments to sustainability issues 1 1 1
Contribution to economic development 1 1 1
Note: AD, abiotic depletion; AC, acidification; EU, eutrophication; GW, global warming; OPD, ozone layer depletion; HT, human toxicity; WAE,
fresh water aquatic ecotoxicity; MAE, marine aquatic ecotoxicity; TE, terrestrial ecotoxicity; PO, photochemical oxidation; ED, energy
consumption.