
Page 22 - Low Temperature Energy Systems with Applications of Renewable Energy
P. 22
Principles and operation of refrigeration and heat pump systems 11
0.40
o
0.35 20 C 30 C
Carnot cycle efficiency 0.25 40 C
o
0.30
0.20
o
0.15
0.10
0.05
0.00
75 100 125 150 175 200
o
Heat source temperature, C
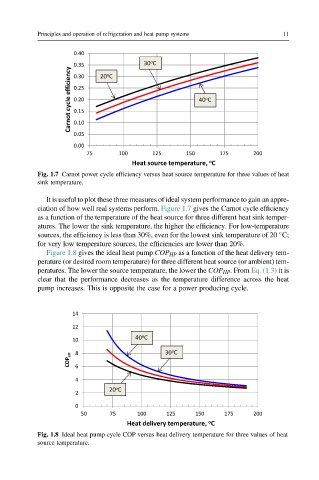
Fig. 1.7 Carnot power cycle efficiency versus heat source temperature for three values of heat
sink temperature.
It is useful to plot these three measures of ideal system performance to gain an appre-
ciation of how well real systems perform. Figure 1.7 gives the Carnot cycle efficiency
as a function of the temperature of the heat source for three different heat sink temper-
atures. The lower the sink temperature, the higher the efficiency. For low-temperature
sources, the efficiency is less than 30%, even for the lowest sink temperature of 20 C;
for very low temperature sources, the efficiencies are lower than 20%.
Figure 1.8 gives the ideal heat pump COP HP as a function of the heat delivery tem-
perature (or desired room temperature) for three different heat source (or ambient) tem-
peratures. The lower the source temperature, the lower the COP HP . From Eq. (1.3) it is
clear that the performance decreases as the temperature difference across the heat
pump increases. This is opposite the case for a power producing cycle.
14
12
o
10 40 C
o
8 30 C
COP HP 6
4
20 C
o
2
0
50 75 100 125 150 175 200
o
Heat delivery temperature, C
Fig. 1.8 Ideal heat pump cycle COP versus heat delivery temperature for three values of heat
source temperature.