
Page 102 - MATLAB an introduction with applications
P. 102
MATLAB Basics ——— 87
H
r
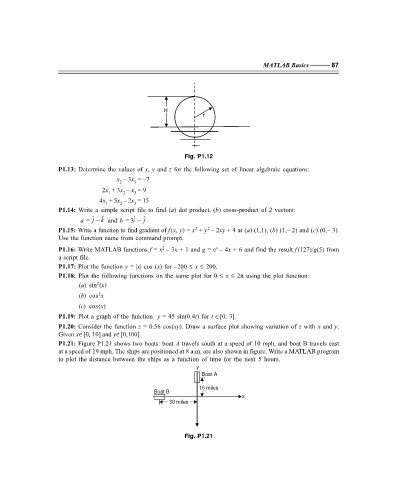
Fig. P1.12
P1.13: Determine the values of x, y and z for the following set of linear algebraic equations:
x – 3x = –7
3
2
2x + 3x – x = 9
1 2 3
4x + 5x – 2x = 15
1
3
2
P1.14: Write a simple script file to find (a) dot product, (b) cross-product of 2 vectors:
ˆ
ˆ
a = j and b = 3i ˆ j
ˆ
k
2
P1.15: Write a function to find gradient of f(x, y) = x + y – 2xy + 4 at (a) (1,1), (b) (1,– 2) and (c) (0,– 3).
2
Use the function name from command prompt.
2
x
P1.16: Write MATLAB functions f = x – 3x + 1 and g = e – 4x + 6 and find the result f(127)/g(5) from
a script file.
P1.17: Plot the function y = |x| cos (x) for –200 ≤ x ≤ 200.
P1.18: Plot the following functions on the same plot for 0 ≤ x ≤ 2π using the plot function:
2
(a) sin (x)
2
(b) cos x
(c) cos(x)
P1.19: Plot a graph of the function y = 45 sin(0.4t) for t ∈[0, 3].
P1.20: Consider the function z = 0.56 cos(xy). Draw a surface plot showing variation of z with x and y.
Given x∈[0, 10] and y∈[0,100].
P1.21: Figure P1.21 shows two boats: boat A travels south at a speed of 10 mph, and boat B travels east
at a speed of 19 mph. The ships are positioned at 8 a.m. are also shown in figure. Write a MATLAB program
to plot the distance between the ships as a function of time for the next 5 hours.
y
Boat A
16 miles
Boat B
x
30 miles
Fig. P1.21
F:\Final Book\Sanjay\IIIrd Printout\Dt. 10-03-09