
Page 164 - MATLAB an introduction with applications
P. 164
Control Systems ——— 149
>> subplot (211), nyquist (num, den)
>> subplot (212), Nichols (num, den)
>> ngrid
>> axis ([50 360 –40 30])
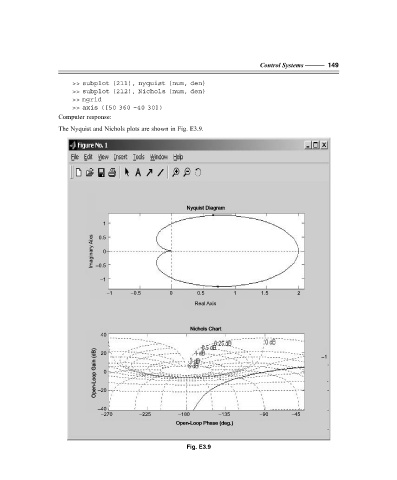
Computer response:
The Nyquist and Nichols plots are shown in Fig. E3.9.
Diagram
Nyquist
Nyquist Diagram
1
Imaginary Aixs Imaginary Axis 0.5 0
Imaginary Axis
–0.5
–1
–1 –0.5 0 0.5 1 1.5 2
Real Axis
Real Axis
Nyquist Diagram
Nyquist Diagram
Nichols Chart
Nichols Chart
40
(dB) (dB) 20 –1
Gain Gain 0
Open-Loop Open-Loop –20
–40
–270 –225 –180 –135 –90 –45
Open-Loop Phase (deg.)
Open-Loop Phase (deg.)
Fig. E3.9
F:\Final Book\Sanjay\IIIrd Printout\Dt. 10-03-09