Page 165 - MATLAB an introduction with applications
P. 165

150 ———  MATLAB: An Introduction with Applications

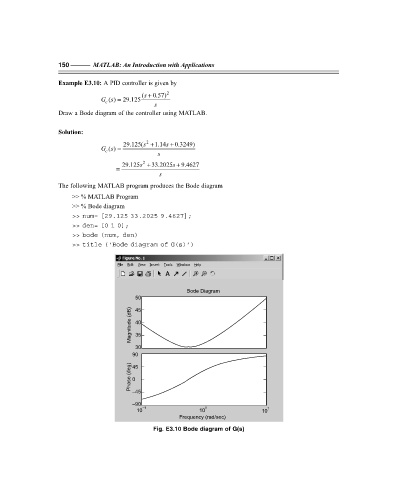
                   Example E3.10: A PID controller is given by

                                             (s +  0.57) 2
                                  ( ) =
                                Gs     29.125
                                 c
                                                 s
                   Draw a Bode diagram of the controller using MATLAB.
                   Solution:
                                              2
                                       29.125(s + 1.14s +  0.3249)
                                  () =
                                Gs
                                 c
                                                  s
                                             2
                                       29.125s + 33.2025s +  9.4627
                                       =
                                                  s
                   The following MATLAB program produces the Bode diagram
                       >> % MATLAB Program
                       >> % Bode diagram
                       >> num= [29.125 33.2025 9.4627];
                       >> den= [0 1 0];
                       >> bode (num, den)
                       >> title (‘Bode diagram of G(s)’)


                                                           Bode Diagram
                                           50
                                         (dB)  45
                                         Magnitude  40

                                           35

                                           30
                                          90
                                         (deg)  45

                                         Phase  0
                                          –45
                                          –90
                                             –1                 0                  1
                                           10                 10                  10
                                                        Frequency (rad/sec)
                                                Fig. E3.10 Bode diagram of G(s)


                   F:\Final Book\Sanjay\IIIrd Printout\Dt. 10-03-09
   160   161   162   163   164   165   166   167   168   169   170