
Page 169 - MATLAB an introduction with applications
P. 169
154 ——— MATLAB: An Introduction with Applications
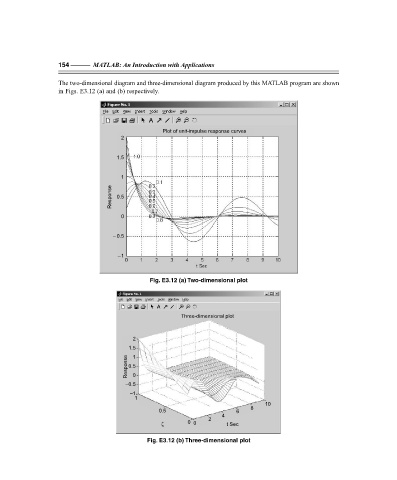
The two-dimensional diagram and three-dimensional diagram produced by this MATLAB program are shown
in Figs. E3.12 (a) and (b) respectively.
Plot of unit-impulse response curves
2
1.5
1
Response 0.5
0
– 0.5
–1
Fig. E3.12 (a) Two-dimensional plot
Three-dimensional plot
2
1.5
1
Response 0.5
0
–0.5
–1
1
10
8
0.5 6
4
2
ζ 0 0 t Sec
Fig. E3.12 (b) Three-dimensional plot
F:\Final Book\Sanjay\IIIrd Printout\Dt. 10-03-09