
Page 174 - MATLAB an introduction with applications
P. 174
Control Systems ——— 159
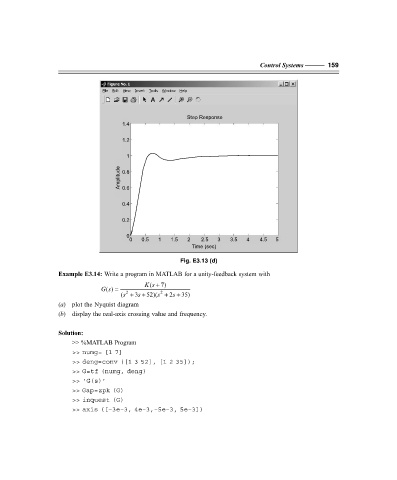
Step Response
1.4
1.2
1
Amplitude 0.8
0.6
0.4
0.2
0
0 0.5 1 1.5 2 2.5 3 3.5 4 4.5 5
Time (sec)
Fig. E3.13 (d)
Example E3.14: Write a program in MATLAB for a unity-feedback system with
( +
Ks 7)
() =
Gs
2
2
(s + 3s + 52)(s + 2s + 35)
(a) plot the Nyquist diagram
(b) display the real-axis crossing value and frequency.
Solution:
>> %MATLAB Program
>> numg= [1 7]
>> deng=conv ([1 3 52], [1 2 35]);
>> G=tf (numg, deng)
>> ‘G(s)’
>> Gap=zpk (G)
>> inquest (G)
>> axis ([–3e–3, 4e–3,–5e–3, 5e–3])
F:\Final Book\Sanjay\IIIrd Printout\Dt. 10-03-09