Page 67 - MATLAB an introduction with applications
P. 67

52 ———  MATLAB: An Introduction with Applications

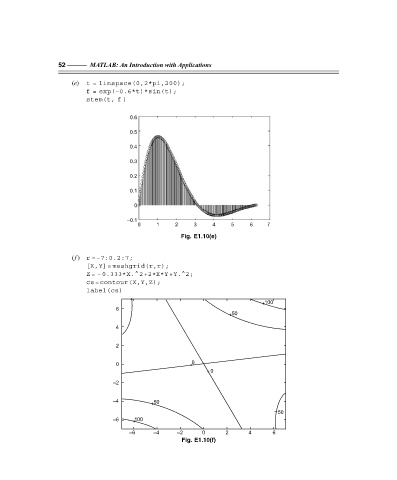
                       (e)  t = linspace(0,2*pi,200);
                            f = exp(–0.6*t)*sin(t);
                            stem(t, f)


                                         0.6
                                         0.5

                                         0.4

                                         0.3

                                         0.2

                                         0.1
                                          0

                                        –0.1
                                           0     1     2     3    4     5     6    7
                                                         Fig. E1.10(e)


                       (f ) r =–7:0.2:7;
                            [X,Y]= meshgrid(r,r);
                            Z = –0.333*X.^2+2*X*Y+Y.^2;
                            cs=contour(X,Y,Z);
                            label(cs)
                                         +
                                                                                  + 100
                                     6
                                                                       + 50

                                     4

                                     2


                                     0                     + 0
                                                                 + 0
                                    –2


                                    –4          50
                                                +
                                                                                       50
                                    –6    + 100
                                         –6     –4      –2     0      2       4      6
                                                         Fig. E1.10(f)


                   F:\Final Book\Sanjay\IIIrd Printout\Dt. 10-03-09
   62   63   64   65   66   67   68   69   70   71   72