
Page 69 - MATLAB an introduction with applications
P. 69
54 ——— MATLAB: An Introduction with Applications
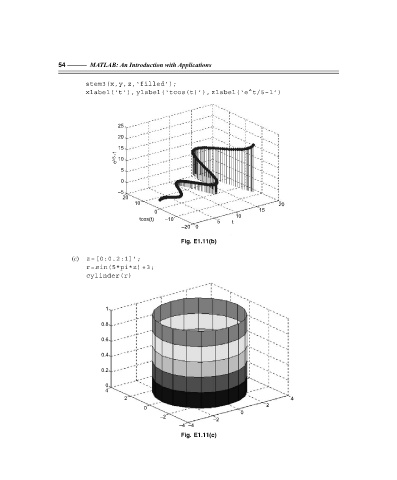
stem3(x,y,z,‘filled’);
xlabel(‘t’), ylabel(‘tcos(t)’), zlabel(‘e^t/5–1’)
25
20
15
e /5 -1 10
t
5
0
–5
20
10 20
0 15
10
tcos(t) –10
5 t
–20 0
Fig. E1.11(b)
(c) z=[0:0.2:1]’;
r=sin(5*pi*z) +3;
cylinder(r)
1
0.8
0.6
0.4
0.2
0
4
2 4
2
0
0
–2
–2
–4 –4
Fig. E1.11(c)
F:\Final Book\Sanjay\IIIrd Printout\Dt. 10-03-09