Page 68 - MATLAB an introduction with applications
P. 68

MATLAB Basics ——— 53

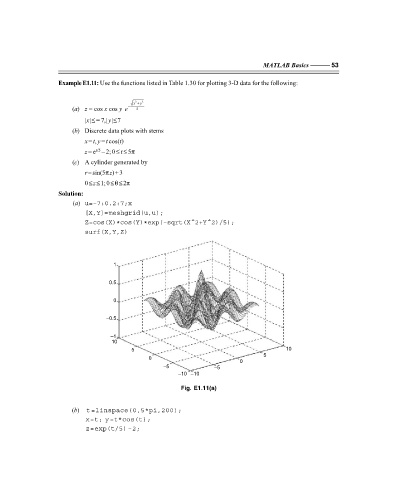
                   Example E1.11: Use the functions listed in Table 1.30 for plotting 3-D data for the following:


                                           2
                                          x +  y  2
                       (a) z = cos x cos y  e −  5
                           |x| ≤ = 7, |y| ≤ 7
                       (b) Discrete data plots with stems
                           x = t, y = t cos(t)
                           z = e  – 2; 0 ≤ t ≤ 5π
                               t/5
                       (c) A cylinder generated by
                           r = sin(5πz) + 3
                           0 ≤ z ≤ 1; 0 ≤ θ ≤ 2π
                   Solution:
                       (a) u=–7:0.2:7;x
                           [X,Y]=meshgrid(u,u);
                           Z=cos(X)*cos(Y)*exp(–sqrt(X^2+Y^2)/5);
                           surf(X,Y,Z)


                                    1

                                   0.5


                                    0

                                  –0.5


                                   –1
                                   10
                                          5                                              10
                                                                                  5
                                               0
                                                                           0
                                                   –5              –5
                                                        –10 –10
                                                         Fig. E1.11(a)


                       (b)  t=linspace(0,5*pi,200);
                           x=t; y=t*cos(t);
                           z=exp(t/5) –2;


                   F:\Final Book\Sanjay\IIIrd Printout\Dt. 10-03-09
   63   64   65   66   67   68   69   70   71   72   73