
Page 70 - MATLAB an introduction with applications
P. 70
MATLAB Basics ——— 55
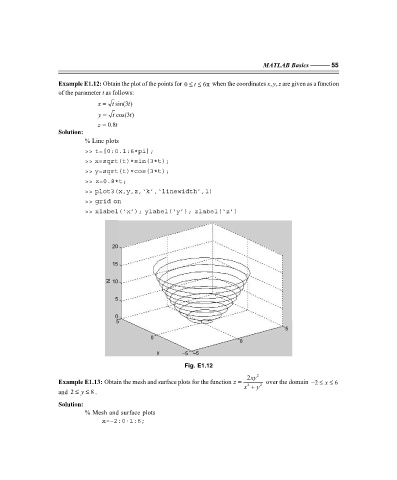
Example E1.12: Obtain the plot of the points for 0 ≤≤t 6π when the coordinates x, y, z are given as a function
of the parameter t as follows:
x = t sin(3 )
t
y = t cos(3 )
t
z = 0.8t
Solution:
% Line plots
>> t=[0:0.1:6*pi];
>> x=sqrt(t)*sin(3*t);
>> y=sqrt(t)*cos(3*t);
>> z=0.8*t;
>> plot3(x,y,z,‘k’,‘linewidth’,1)
>> grid on
>> xlabel(‘x’); ylabel(‘y’); zlabel(‘z’)
20
15
N 10
5
0
5
5
0
0
y –5 –5
Fig. E1.12
2xy 2
Example E1.13: Obtain the mesh and surface plots for the function =z x 2 + y 2 over the domain 2−≤ x ≤ 6
and 2 ≤ y ≤ 8 .
Solution:
% Mesh and surface plots
.
x=–2:0 1:6;
F:\Final Book\Sanjay\IIIrd Printout\Dt. 10-03-09