Page 442 -
P. 442

Single-Crystal Silicon Carbide MEMS: Fabrication, Characterization, and Reliability        7-31


                           320

                           300


                           280                                Pre AST zero offset (0 psi; cooling)
                          Output (mV)  260                    Pre AST gross (100 psi; cooling)


                           240


                           220

                           200
                              0       50     100     150     200     250     300     350     400
                        (a)                             Temperature (°C)

                            20
                                                                                         25°C
                            18   Vin = 5V
                                 Sensor # 29                                             100°C
                            16   Sensitivity: 36.60 µV/V/psi@25°C                        200°C
                          Net bridge output (mV)  12                                     300°C
                                             20.50 µV/V/psi@400°C

                            14
                                                                                         400°C
                            10
                             8
                             6
                             4
                             2
                             0
                              0     10     20    30    40     50    60    70     80    90    100
                        (b)                           Applied pressure (psi)


                            38
                            36
                                                                 Vin = 5 V
                            34                                   Sensor # 29
                                                                 Sensitivity: 36.60 µV/V/psi@25°C
                          Sensitivity (µV/V/psi)  30
                            32


                            28

                            26
                            24

                            22

                            20
                              0       50     100     150     200     250     300     350     400
                        (c)                             Temperature (°C)

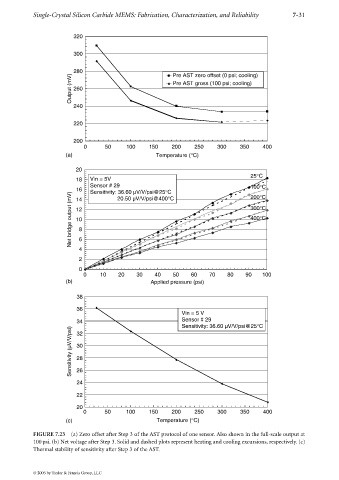
             FIGURE 7.23 (a) Zero offset after Step 3 of the AST protocol of one sensor. Also shown in the full-scale output at
             100psi. (b) Net voltage after Step 3. Solid and dashed plots represent heating and cooling excursions, respectively. (c)
             Thermal stability of sensitivity after Step 3 of the AST.


             © 2006 by Taylor & Francis Group, LLC
   437   438   439   440   441   442   443   444   445   446   447