
Page 441 -
P. 441
7-30 MEMS: Design and Fabrication
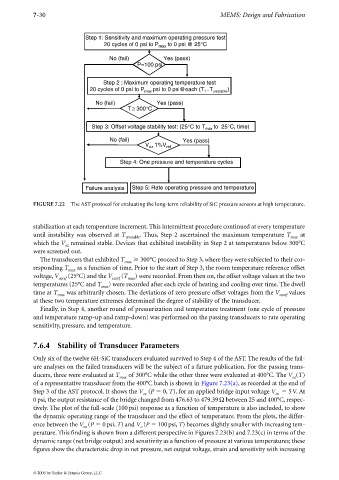
Step 1: Sensitivity and maximum operating pressure test
20 cycles of 0 psi to P max to 0 psi @ 25°C
No (fail) Yes (pass)
P=100 psi
Step 2 : Maximum operating temperature test
20 cycles of 0 psi to P max psi to 0 psi@each (T ..T unstable )
1
No (fail) Yes (pass)
T≥ 300°C
Step 3: Offset voltage stability test: (25°C to T to 25°C, time)
max
No (fail) Yes (pass)
V 1%V ref
oz
Step 4: One pressure and temperature cycles
Failure analysis Step 5: Rate operating pressure and temperature
FIGURE 7.22 The AST protocol for evaluating the long-term reliability of SiC pressure sensors at high temperature.
stabilization at each temperature increment. This intermittent procedure continued at every temperature
until instability was observed at T .Thus, Step 2 ascertained the maximum temperature T at
unstable max
which the V remained stable. Devices that exhibited instability in Step 2 at temperatures below 300°C
oz
were screened out.
The transducers that exhibited T max 300°C proceed to Step 3, where they were subjected to their cor-
responding T as a function of time. Prior to the start of Step 3, the room temperature reference offset
max
voltage, V (25°C) and the V (T ) were recorded. From then on, the offset voltage values at the two
ozref ozref max
temperatures (25°C and T max )wererecorded after each cycle of heating and cooling over time. The dwell
time at T was arbitrarily chosen. The deviations of zero pressure offset voltages from the V values
max ozref
at these two temperature extremes determined the degree of stability of the transducer.
Finally, in Step 4, another round of pressurization and temperature treatment (one cycle of pressure
and temperature ramp-up and ramp-down) was performed on the passing transducers to rate operating
sensitivity, pressure, and temperature.
7.6.4 Stability of Transducer Parameters
Only six of the twelve 6H-SiC transducers evaluated survived to Step 4 of the AST. The results of the fail-
ure analyses on the failed transducers will be the subject of a future publication. For the passing trans-
ducers, three were evaluated at T of 300°C while the other three were evaluated at 400°C. The V (T)
max oz
of arepresentative transducer from the 400°C batch is shown in Figure 7.23(a), as recorded at the end of
Step 3 of the AST protocol. It shows the V (P 0, T), for an applied bridge input voltage V 5V. At
oz
in
0psi, the output resistance of the bridge changed from 476.63 to 479.39Ω between 25 and 400°C, respec-
tively. The plot of the full-scale (100psi) response as a function of temperature is also included, to show
the dynamic operating range of the transducer and the effect of temperature. From the plots, the differ-
ence between the V (P 0psi, T) and V (P 100psi, T) becomes slightly smaller with increasing tem-
oz
o
perature. This finding is shown from a different perspective in Figures 7.23(b) and 7.23(c) in terms of the
dynamic range (net bridge output) and sensitivity as a function of pressure at various temperatures; these
figures show the characteristic drop in net pressure, net output voltage, strain and sensitivity with increasing
© 2006 by Taylor & Francis Group, LLC