
Page 436 -
P. 436
Single-Crystal Silicon Carbide MEMS: Fabrication, Characterization, and Reliability 7-25
In the case of semiconductors with hexagonal crystal structure (such as 6H-SiC), the problem is much
more complicated, in terms of resolving the piezoresistive constants in different directions. Earlier attempts
to characterize the piezoresistance of 6H-SiC as a function of crystallographic orientation yielded signifi-
cant differences in the obtained values [Rapatskaya et al., 1968, Azimov et al., 1974, Guk et al., 1974a, and
Guk et al., 1974b]. Possible reasons for the discrepancies were the differences and imperfections of the
Lely (1955) platelets, which were the only crystals available at that time, and also the inconsistencies and
quality of the metal ohmic contacts. Recent advances in SiC technology have led to more reproducible
and better quality SiC wafers and ohmic contacts, making it possible to obtain more reliable results.
On the backside of the wafer, a circular cavity mask was aligned with each set of piezoresistors that
form a Wheatstone bridge network. Electrochemical etching (ECE), as previously described, was used to
fabricate the circular diaphragm cavities. The irregularity of the sidewalls and base of the cavity indicates
that a consistent control of the electrochemical etching process is required. This batch of sensors had a
2
diaphragm thickness of about 50 µm and a chip area of 1.48mm . The above process was followed by a
20-hour wet oxidation at 1150°C to ensure complete p–n junction isolation and passivation of the active
elements. Contact holes were etched through the oxide using BHF to expose sections of the resistor ele-
ments. This procedure was followed by in vacuo sputter deposition of the Ti/TaSi /Pt high-temperature
2
metallization and patterning of the metallization by the method described earlier. The wafer was then
diced into chips and individually mounted on specially designed pressure sensor headers. Gold wires were
bonded from the sensor to the header pins to facilitate external electrical connection.
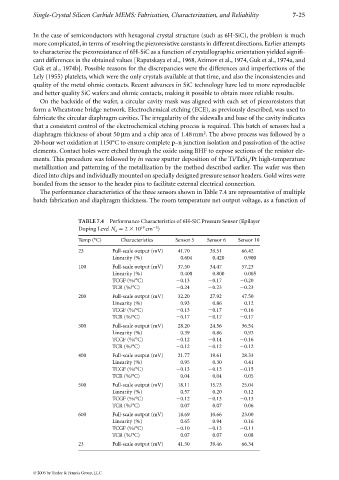
The performance characteristics of the three sensors shown in Table 7.4 are representative of multiple
batch fabrication and diaphragm thickness. The room temperature net output voltage, as a function of
TABLE 7.4 Performance Characteristics of 6H-SiC Pressure Sensor (Epilayer
19
3
Doping Level N 2 10 cm )
d
Temp (°C) Characteristics Sensor 5 Sensor 6 Sensor 10
23 Full-scale output (mV) 41.70 39.51 66.42
Linearity (%) 0.604 0.420 0.900
100 Full-scale output (mV) 37.50 34.47 57.23
Linearity (%) 0.400 0.800 0.005
TCGF (%/°C) 0.13 0.17 0.20
TCR (%/°C) 0.24 0.23 0.23
200 Full-scale output (mV) 32.20 27.92 47.50
Linearity (%) 0.93 0.86 0.12
TCGF (%/°C) 0.13 0.17 0.16
TCR (%/°C) 0.17 0.17 0.17
300 Full-scale output (mV) 28.20 24.56 36.54
Linearity (%) 0.39 0.86 0.93
TCGF (%/°C) 0.12 0.14 0.16
TCR (%/°C) 0.12 0.12 0.12
400 Full-scale output (mV) 21.77 19.61 28.33
Linearity (%) 0.95 0.30 0.41
TCGF (%/°C) 0.13 0.13 0.15
TCR (%/°C) 0.04 0.04 0.05
500 Full-scale output (mV) 18.11 15.73 25.04
Linearity (%) 0.57 0.20 0.12
TCGF (%/°C) 0.12 0.13 0.13
TCR (%/°C) 0.07 0.07 0.06
600 Full-scale output (mV) 18.69 10.66 23.00
Linearity (%) 0.65 0.94 0.16
TCGF (%/°C) 0.10 0.13 0.11
TCR (%/°C) 0.07 0.07 0.08
23 Full-scale output (mV) 41.50 39.46 66.34
© 2006 by Taylor & Francis Group, LLC