
Page 433 -
P. 433
7-22 MEMS: Design and Fabrication
PER
V l
E
R A
T
E
DRV
PER
H
O l
R
I V
Z
DRV
PER
S 200
T
E µA
P
ON
OM 5
PER
DIV
(a) (b) (c) (d)
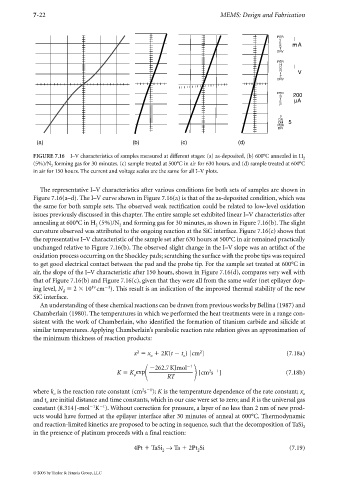
FIGURE 7.16 I–V characteristics of samples measured at different stages: (a) as-deposited, (b) 600°C annealed in H 2
(5%)/N forming gas for 30 minutes. (c) sample treated at 500°C in air for 630 hours, and (d) sample treated at 600°C
2
in air for 150 hours. The current and voltage scales are the same for all I–V plots.
The representative I–V characteristics after various conditions for both sets of samples are shown in
Figure 7.16(a–d). The I–V curve shown in Figure 7.16(a) is that of the as-deposited condition, which was
the same for both sample sets. The observed weak rectification could be related to low-level oxidation
issues previously discussed in this chapter. The entire sample set exhibited linear I–V characteristics after
annealing at 600°C in H (5%)/N and forming gas for 30 minutes, as shown in Figure 7.16(b). The slight
2 2
curvature observed was attributed to the ongoing reaction at the SiC interface. Figure 7.16(c) shows that
the representative I–V characteristic of the sample set after 630 hours at 500°C in air remained practically
unchanged relative to Figure 7.16(b). The observed slight change in the I–V slope was an artifact of the
oxidation process occurring on the Shockley pads; scratching the surface with the probe tips was required
to get good electrical contact between the pad and the probe tip. For the sample set treated at 600°C in
air, the slope of the I–V characteristic after 150 hours, shown in Figure 7.16(d), compares very well with
that of Figure 7.16(b) and Figure 7.16(c), given that they were all from the same wafer (net epilayer dop-
3
19
ing level, N 2 10 cm ). This result is an indication of the improved thermal stability of the new
d
SiC interface.
An understanding of these chemical reactions can be drawn from previous works by Bellina (1987) and
Chamberlain (1980). The temperatures in which we performed the heat treatments were in a range con-
sistent with the work of Chamberlain, who identified the formation of titanium carbide and silicide at
similar temperatures. Applying Chamberlain’s parabolic reaction rate relation gives an approximation of
the minimum thickness of reaction products:
2
2
x x 2K(t t ) [cm ] (7.18a)
o o
262.7KJmol 1 2 1
K K exp [cm s ] (7.18b)
o
RT
2 1
where k is the reaction rate constant (cm s ); K is the temperature dependence of the rate constant; x
o o
and t are initial distance and time constants, which in our case were set to zero; and R is the universal gas
o
1
1
constant (8.314 J-mol K ). Without correction for pressure, a layer of no less than 2 nm of new prod-
ucts would have formed at the epilayer interface after 30 minutes of anneal at 600°C. Thermodynamic
and reaction-limited kinetics are proposed to be acting in sequence, such that the decomposition of TaSi 2
in the presence of platinum proceeds with a final reaction:
4Pt TaSi → Ta 2Pt Si (7.19)
2
2
© 2006 by Taylor & Francis Group, LLC