
Page 431 -
P. 431
7-20 MEMS: Design and Fabrication
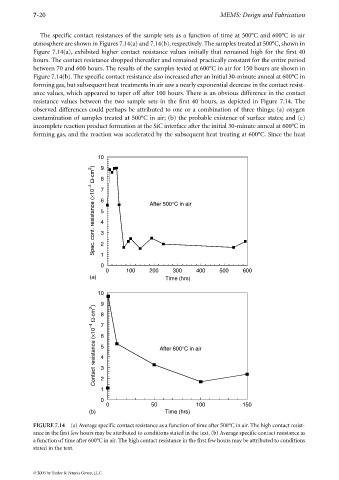
The specific contact resistances of the sample sets as a function of time at 500°C and 600°C in air
atmosphere are shown in Figures 7.14(a) and 7.14(b), respectively. The samples treated at 500°C, shown in
Figure 7.14(a), exhibited higher contact resistance values initially that remained high for the first 40
hours. The contact resistance dropped thereafter and remained practically constant for the entire period
between 70 and 600 hours. The results of the samples tested at 600°C in air for 150 hours are shown in
Figure 7.14(b). The specific contact resistance also increased after an initial 30-minute anneal at 600°C in
forming gas, but subsequent heat treatments in air saw a nearly exponential decrease in the contact resist-
ance values, which appeared to taper off after 100 hours. There is an obvious difference in the contact
resistance values between the two sample sets in the first 40 hours, as depicted in Figure 7.14. The
observed differences could perhaps be attributed to one or a combination of three things: (a) oxygen
contamination of samples treated at 500°C in air; (b) the probable existence of surface states; and (c)
incomplete reaction product formation at the SiC interface after the initial 30-minute anneal at 600°C in
forming gas, and the reaction was accelerated by the subsequent heat treating at 600°C. Since the heat
10
Ω-cm 2 ) 9
8
Spec. cont. resistance (×10 −4 6 After 500°C in air
7
5
4
3
2
1
0
0 100 200 300 400 500 600
(a) Time (hrs)
10
9
Ω-cm 2 ) 8
7
Contact resistance (×10 −4 6 After 600°C in air
5
4
3
2
1
0
0 50 100 150
(b) Time (hrs)
FIGURE 7.14 (a) Average specific contact resistance as a function of time after 500°C in air. The high contact resist-
ance in the first few hours may be attributed to conditions stated in the text. (b) Average specific contact resistance as
a function of time after 600°C in air. The high contact resistance in the first few hours may be attributed to conditions
stated in the text.
© 2006 by Taylor & Francis Group, LLC