
Page 432 -
P. 432
Single-Crystal Silicon Carbide MEMS: Fabrication, Characterization, and Reliability 7-21
treatments in air between the sample sets are different, variations in activation energies may cause differ-
ences in product formation, thereby leading to variations in electrical characteristics. After the contrast
in results for times less than 100 hours between the sample sets, the average specific contact resistance for
2
both sets leveled off to values around 2–3 10 4 Ω-cm .
To begin understanding the active mechanisms, we examined the relationship between the electrical and
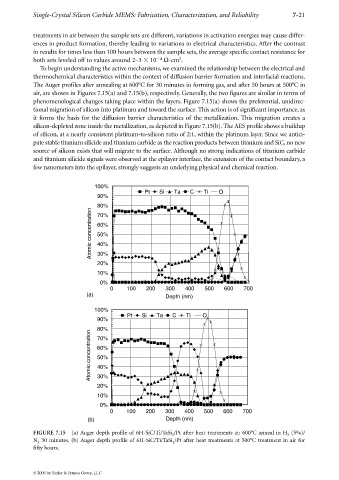
thermochemical characteristics within the context of diffusion barrier formation and interfacial reactions.
The Auger profiles after annealing at 600°C for 30 minutes in forming gas, and after 50 hours at 500°C in
air, are shown in Figures 7.15(a) and 7.15(b), respectively. Generally, the two figures are similar in terms of
phenomenological changes taking place within the layers. Figure 7.15(a) shows the preferential, unidirec-
tional migration of silicon into platinum and toward the surface. This action is of significant importance, as
it forms the basis for the diffusion barrier characteristics of the metallization. This migration creates a
silicon-depleted zone inside the metallization, as depicted in Figure 7.15(b). The AES profile shows a buildup
of silicon, at a nearly consistent platinum-to-silicon ratio of 2:1, within the platinum layer. Since we antici-
pate stable titanium silicide and titanium carbide as the reaction products between titanium and SiC, no new
source of silicon exists that will migrate to the surface. Although no strong indications of titanium carbide
and titanium silicide signals were observed at the epilayer interface, the extension of the contact boundary, a
few nanometers into the epilayer, strongly suggests an underlying physical and chemical reaction.
100%
Pt Si Ta C Ti O
90%
80%
Atomic concentration 60%
70%
50%
40%
30%
20%
10%
0%
0 100 200 300 400 500 600 700
(a) Depth (nm)
100%
Pt Si Ta C Ti O
90%
80%
Atomic concentration 60%
70%
50%
40%
30%
20%
10%
0%
0 100 200 300 400 500 600 700
(b) Depth (nm)
FIGURE 7.15 (a) Auger depth profile of 6H-SiC/Ti/TaSi /Pt after heat treatments at: 600°C anneal in H (5%)/
2
2
N 30 minutes. (b) Auger depth profile of 6H-SiC/Ti/TaSi /Pt after heat treatments at 500°C treatment in air for
2 2
fifty hours.
© 2006 by Taylor & Francis Group, LLC