
Page 437 -
P. 437
7-26 MEMS: Design and Fabrication
70
60
Net bridge output (mV) 50
40
30
20
10
0
0 100 200 300 400 500 600 700 800 900 1000
Applied pressure (psi)
23 C 100 C 200 C 300 C 400 C 500 C 600 C
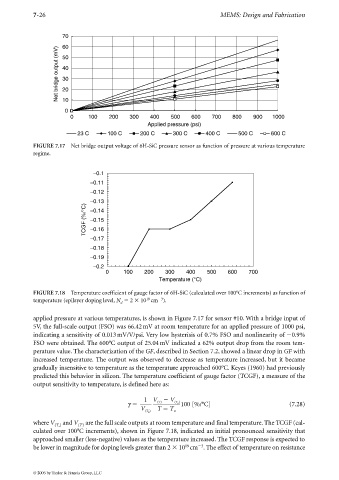
FIGURE 7.17 Net bridge output voltage of 6H-SiC pressure sensor as function of pressure at various temperature
regime.
−0.1
−0.11
−0.12
−0.13
TCGF (%/°C) −0.14
−0.15
−0.16
−0.17
−0.18
−0.19
−0.2
0 100 200 300 400 500 600 700
Temperature (°C)
FIGURE 7.18 Temperature coefficient of gauge factor of 6H-SiC (calculated over 100°C increments) as function of
19
3
temperature (epilayer doping level, N 2 10 cm ).
d
applied pressure at various temperatures, is shown in Figure 7.17 for sensor #10. With a bridge input of
5V, the full-scale output (FSO) was 66.42mV at room temperature for an applied pressure of 1000 psi,
indicating a sensitivity of 0.013mV/V/psi. Very low hysterisis of 0.7% FSO and nonlinearity of 0.9%
FSO were obtained. The 600°C output of 25.04mV indicated a 62% output drop from the room tem-
perature value. The characterization of the GF,described in Section 7.2, showed a linear drop in GF with
increased temperature. The output was observed to decrease as temperature increased, but it became
gradually insensitive to temperature as the temperature approached 600°C. Keyes (1960) had previously
predicted this behavior in silicon. The temperature coefficient of gauge factor (TCGF), a measure of the
output sensitivity to temperature, is defined here as:
1 V V
(T)
(T o )
γ 100 [%/°C] (7.28)
V (T o ) T T o
where V (T o) and V (T) are the full scale outputs at room temperature and final temperature. The TCGF (cal-
culated over 100°C increments), shown in Figure 7.18, indicated an initial pronounced sensitivity that
approached smaller (less-negative) values as the temperature increased. The TCGF response is expected to
19
3
be lower in magnitude for doping levels greater than 2 10 cm . The effect of temperature on resistance
© 2006 by Taylor & Francis Group, LLC