Page 440 -
P. 440
Single-Crystal Silicon Carbide MEMS: Fabrication, Characterization, and Reliability        7-29


             7.6.2 Transducer Parametric Analysis

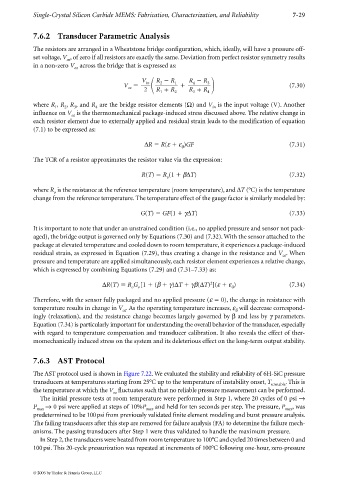
             The resistors are arranged in a Wheatstone bridge configuration, which, ideally, will have a pressure off-
             set voltage, V , of zero if all resistors are exactly the same. Deviation from perfect resistor symmetry results
                        oz
             in a non-zero V across the bridge that is expressed as:
                           oz
                                                   V    R   R      R   R
                                                                          3
                                                              1
                                                                     4
                                                    in
                                                         2
                                            V                                                          (7.30)
                                              oz    2    R   R     R   R
                                                         1    2      3    4
             where R , R , R , and R are the bridge resistor elements (Ω) and V is the input voltage (V). Another
                    1   2  3       4                                        in
             influence on V is the thermomechanical package-induced stress discussed above. The relative change in
                          oz
             each resistor element due to externally applied and residual strain leads to the modification of equation
             (7.1) to be expressed as:
                                                    ∆R   R(ε   ε )GF                                   (7.31)
                                                                 δ
             The TCR of a resistor approximates the resistor value via the expression:


                                                   R(T)   R (1   β∆T)                                  (7.32)
                                                            o
             where R is the resistance at the reference temperature (room temperature), and ∆T (°C) is the temperature
                    o
             change from the reference temperature. The temperature effect of the gauge factor is similarly modeled by:

                                                  G(T)   GF(1   γ∆T)                                   (7.33)


             It is important to note that under an unstrained condition (i.e., no applied pressure and sensor not pack-
             aged), the bridge output is governed only by Equations (7.30) and (7.32). With the sensor attached to the
             package at elevated temperature and cooled down to room temperature, it experiences a package-induced
             residual strain, as expressed in Equation (7.29), thus creating a change in the resistance and V . When
                                                                                                    oz
             pressure and temperature are applied simultaneously, each resistor element experiences a relative change,
             which is expressed by combining Equations (7.29) and (7.31–7.33) as:


                                                                           2
                                     ∆R(T)   R G [1   (β   γ)∆T   γβ(∆T) ](ε   ε )                     (7.34)
                                                 o
                                               o
                                                                                  δ
             Therefore, with the sensor fully packaged and no applied pressure (ε   0), the change in resistance with
             temperature results in change in V . As the operating temperature increases, ε will decrease correspond-
                                            oz
                                                                                    δ
             ingly (relaxation), and the resistance change becomes largely governed by β and less by γ parameters.
             Equation (7.34) is particularly important for understanding the overall behavior of the transducer, especially
             with regard to temperature compensation and transducer calibration. It also reveals the effect of ther-
             momechanically induced stress on the system and its deleterious effect on the long-term output stability.


             7.6.3 AST Protocol

             The AST protocol used is shown in Figure 7.22.We evaluated the stability and reliability of 6H-SiC pressure
             transducers at temperatures starting from 25°C up to the temperature of instability onset, T  .This is
                                                                                                unstable
             the temperature at which the V fluctuates such that no reliable pressure measurement can be performed.
                                         oz
               The initial pressure tests at room temperature were performed in Step 1, where 20 cycles of 0 psi →
             P max  → 0 psi were applied at steps of 10%P max  and held for ten seconds per step. The pressure, P max , was
             predetermined to be 100psi from previously validated finite element modeling and burst pressure analysis.
             The failing transducers after this step are removed for failure analysis (FA) to determine the failure mech-
             anisms. The passing transducers after Step 1 were thus validated to handle the maximum pressure.
               In Step 2,the transducers were heated from room temperature to 100°C and cycled 20 times between 0 and
             100psi. This 20-cycle pressurization was repeated at increments of 100°C following one-hour, zero-pressure


             © 2006 by Taylor & Francis Group, LLC

