
Page 169 - Machine Learning for Subsurface Characterization
P. 169
Robust geomechanical characterization Chapter 5 143
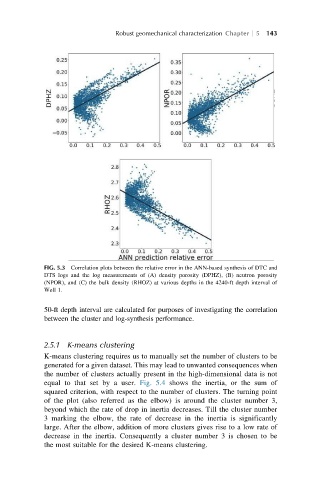
FIG. 5.3 Correlation plots between the relative error in the ANN-based synthesis of DTC and
DTS logs and the log measurements of (A) density porosity (DPHZ), (B) neutron porosity
(NPOR), and (C) the bulk density (RHOZ) at various depths in the 4240-ft depth interval of
Well 1.
50-ft depth interval are calculated for purposes of investigating the correlation
between the cluster and log-synthesis performance.
2.5.1 K-means clustering
K-means clustering requires us to manually set the number of clusters to be
generated for a given dataset. This may lead to unwanted consequences when
the number of clusters actually present in the high-dimensional data is not
equal to that set by a user. Fig. 5.4 shows the inertia, or the sum of
squared criterion, with respect to the number of clusters. The turning point
of the plot (also referred as the elbow) is around the cluster number 3,
beyond which the rate of drop in inertia decreases. Till the cluster number
3 marking the elbow, the rate of decrease in the inertia is significantly
large. After the elbow, addition of more clusters gives rise to a low rate of
decrease in the inertia. Consequently a cluster number 3 is chosen to be
the most suitable for the desired K-means clustering.