
Page 174 - Machine Learning for Subsurface Characterization
P. 174
148 Machine learning for subsurface characterization
2
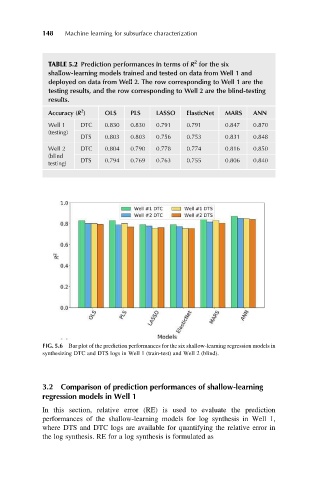
TABLE 5.2 Prediction performances in terms of R for the six
shallow-learning models trained and tested on data from Well 1 and
deployed on data from Well 2. The row corresponding to Well 1 are the
testing results, and the row corresponding to Well 2 are the blind-testing
results.
2
Accuracy (R ) OLS PLS LASSO ElasticNet MARS ANN
Well 1 DTC 0.830 0.830 0.791 0.791 0.847 0.870
(testing)
DTS 0.803 0.803 0.756 0.753 0.831 0.848
Well 2 DTC 0.804 0.790 0.778 0.774 0.816 0.850
(blind
testing) DTS 0.794 0.769 0.763 0.755 0.806 0.840
FIG. 5.6 Bar plot of the prediction performances for the six shallow-learning regression models in
synthesizing DTC and DTS logs in Well 1 (train-test) and Well 2 (blind).
3.2 Comparison of prediction performances of shallow-learning
regression models in Well 1
In this section, relative error (RE) is used to evaluate the prediction
performances of the shallow-learning models for log synthesis in Well 1,
where DTS and DTC logs are available for quantifying the relative error in
the log synthesis. RE for a log synthesis is formulated as